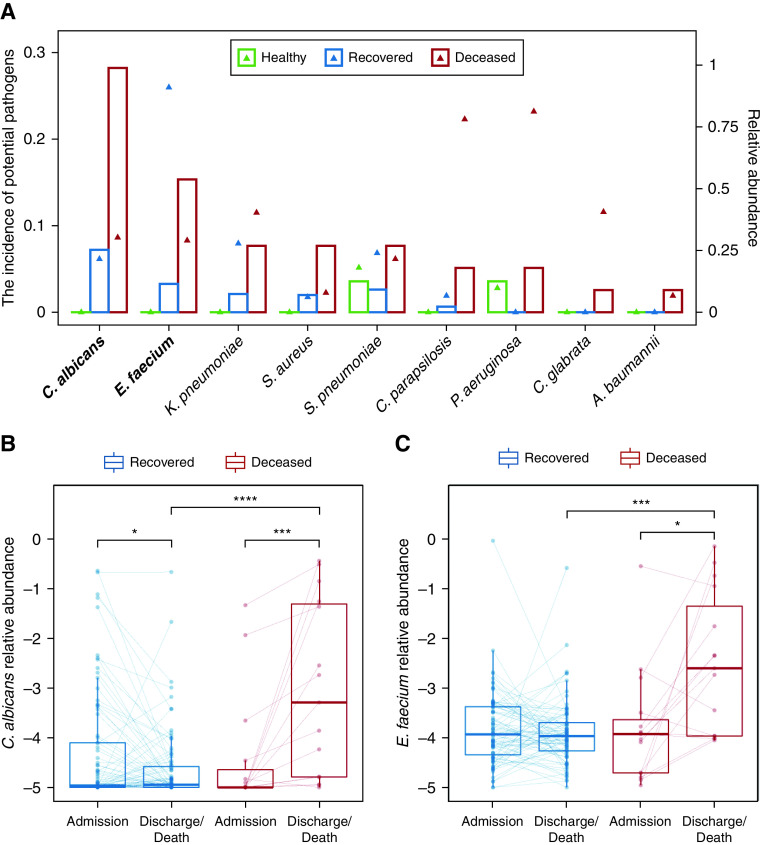
Figure 4.
Codetection of other pathogens in patients with coronavirus disease (COVID-19). (A) The incidence of potential pathogens in different groups. The bar plot shows the incidence of each potential pathogen (left y-axis), and the triangle shows the median abundance of the pathogen in positive samples (right y-axis). The potential pathogens enriched in deceased patients with COVID-19 were labeled in bold (Fisher’s exact test). (B and C) The abundance of Candida albicans (B) and Enterococcus faecium (C) on admission and before discharge/death in paired samples from the same patient. Samples from the same patient were connected by a solid line. The boxes represent 25th–75th percentiles, the horizontal lines indicate the median, and the whiskers were drawn from the box to the extremes (values that were lower/greater than first/third quartile minus/plus 1.5 times the interquartile range were regarded as outliers). *P < 0.05, ***P < 0.001, and ****P < 0.0001. A. baumannii = Acinetobacter baumannii; K. pneumoniae = Klebsiella pneumoniae; P. aeruginosa = Pseudomonas aeruginosa; S. aureus = Staphylococcus aureus; S. pneumoniae = Streptococcus pneumoniae.

