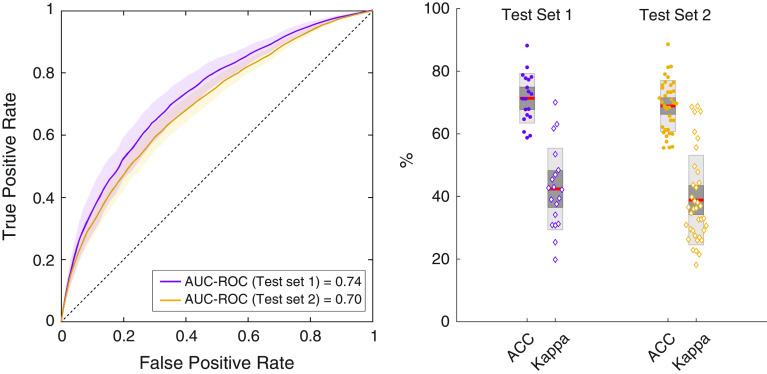
Figure 5.
Classification performance of the learned logistic model using dichotomized probability of obstruction (two classes: low vs. high, with a threshold of 0.5). The left plot shows the mean area under the receiver operating characteristic curve (AUC-ROC) across all subjects in the two sets. Confidence interval is represented by the shaded area. The dashed reference line indicates the AUC-ROC for a randomized classifier (i.e., classifies breaths as low vs. high resistance by chance). Box plots on the right show classification accuracy (ACC) and kappa for each individual subject in the internal and the external test sets. Dark red lines indicate the mean ACC values, with the light and dark shaded sections of the boxes indicating one and two standard deviations.

