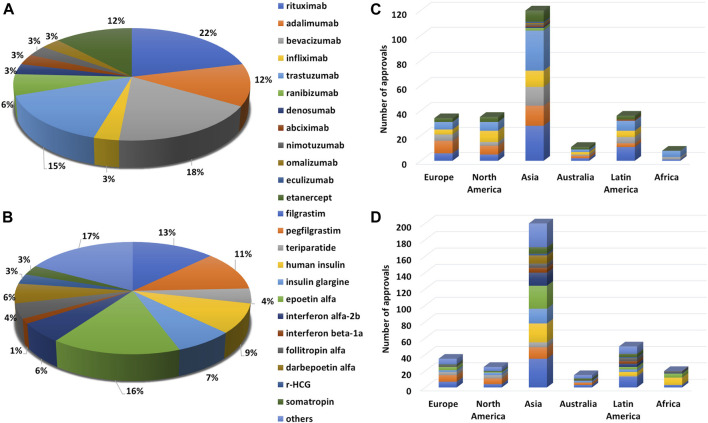
FIGURE 2.
Trend in biosimilar approval for different modalities depicted as percentage of total approvals for a given biologic under (A) mAbs and (B) non-mAbs and global biosimilar approvals (in numbers) across continents i.e., Europe, North America, Asia, Australia, Latin America, and Africa for (C) mAbs and (D) non-mAbs.

