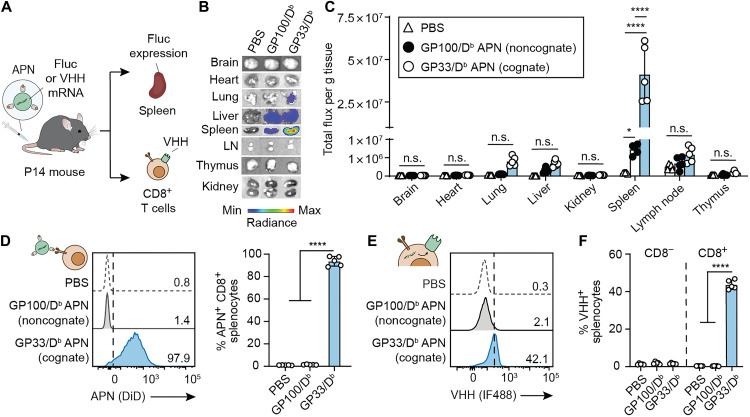
Fig. 3. APNs target and transfect Ag-specific T cells in TCR transgenic P14 mice.
(A) Intravenous injection of GP33/Db APNs to TCR transgenic P14 mice. mRNA encoding Fluc or camelid antibody VHH was loaded in APNs as a reporter. Major organs or splenocytes were harvested for IVIS imaging of Fluc expression or flow analysis of VHH protein expression on the CD8+ splenocytes. GP100/Db APNs were used as a noncognate control. (B) Representative bioluminescence images of various organs were recorded after 6 hours after APN injection to P14 mice. (C) Quantification data of bioluminescence images show in (B). (D) In vivo targeting of GP33/Db APNs to CD8+ splenocytes in P14 mice. *P = 0.0132 between PBS and GP100/Db APNs; ****P < 0.0001 between PBS and GP33/Db APNs and between GP100/Db APNs and GP33/Db APNs; one-way ANOVA and Tukey post-test and correction. (E) Representative flow plot showing in vivo APN-mediated transfection in P14 CD8+ splenocytes. (F) In vivo APN-mediated transfection in both P14 CD8− and CD8+ splenocytes. ****P < 0.0001 between PBS and GP33/Db APNs and between GP100/Db APNs and GP33/Db APNs; one-way ANOVA and Tukey post-test and correction. All data are means ± SD; n = 5 biologically independent mice.

