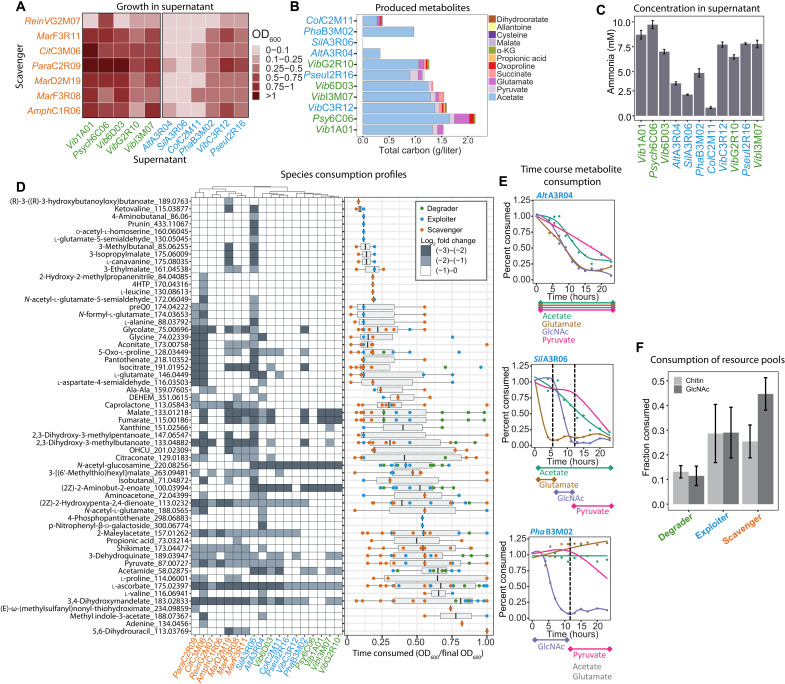
Fig. 3. Metabolite consumption and production profiles among community members.
(A) Growth of scavengers at 36 hours on cell-free supernatants obtained from degraders and exploiters after growth on GlcNAc. (B) Metabolite concentration in cultures of degraders or exploiters after growth on 20 mM GlcNAc. α-KG, α-ketoglutarate. (C) Ammonia concentration in cultures of degraders or exploiters after growth on GlcNAc. (D) Consumption of crossfed metabolites in the pooled supernatant. (Left) FIA-QTOF-MS measurements of metabolites that are consumed by degraders, exploiters, or scavengers (ion intensity log2 < −0.5). (Right) Time course measurements of metabolite consumption. Points represent the fraction of the final OD600 at which metabolite consumption is detected for each species. (E) Relative change of acetate, pyruvate, GlcNAc, and glutamate during growth in the pooled supernatant by three exploiters. Curves are fit using local polynomial regression. (F) Fraction of available metabolites contained in chitin or GlcNAc-derived resource pools that is consumed by each functional guild. All experiments were performed in triplicate. Error bars represent SD. DEHEM, 4-deoxy-α-l-erythro-hex-4-enopyranuronate-β-d-mannuronate; OHCU, 2-oxo-4-hydroxy-4-carboxy-5-ureidoimidazoline. Strain names in green are degraders, blue are exploiters, and orange are scavengers.

