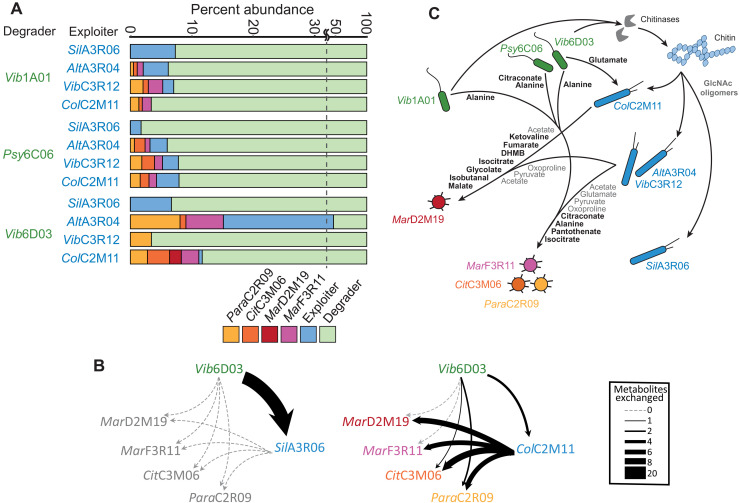
Fig. 4. Outcomes of chitin-degrading cocultures and hypothetical metabolic exchange networks.
(A) Each coculture was seeded with six species: one degrader (green), one exploiter (blue), and each of the four scavengers ParaC2R09 (yellow), CitC3M06 (orange), MarD2M19 (red), and MarF3R11 (purple). Cultures were grown for 5 weeks with four serial dilutions on colloidal chitin, and relative abundance is shown for the final culture. Experiments were performed in triplicate. (B) Two of 12 hypothetical metabolite exchange networks that illustrate the number of metabolites exchanged between species that coexisted in cocultures outcomes from (A). Edge width represents the number of exchanged metabolites. Exchange networks based on the remaining 10 coculture outcomes are contained in dataset S5. (C) A graphical summary of metabolite exchanges that likely contribute to the coculture outcomes. Bolded metabolites are all inferred causal metabolites that may contribute to the growth of individual species. Gray metabolites represent broadly exchanged growth supporting substrates that are secreted by degraders or exploiters grown on GlcNAc and consumed by scavengers. All remaining secreted metabolites and cross-feeding interactions that are not included in this illustration are contained in datasets S1, S3, and S5. DHMB, 2,3-dihydroxy-2-methylbutanoate.

