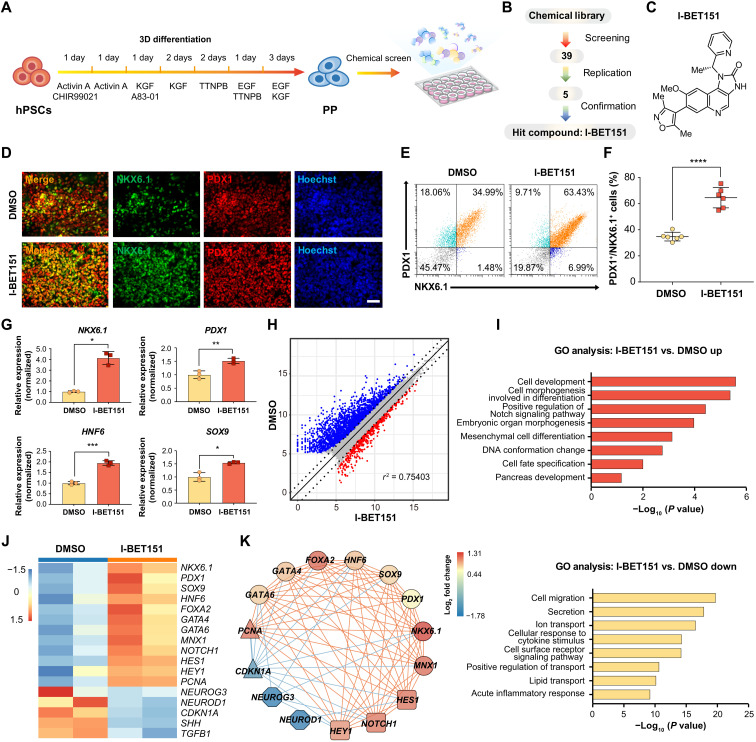
Fig. 1. A chemical screen identified that I-BET151 can promote hPSC-derived pancreatic progenitor expansion.
(A) Schematic representation of the pancreatic differentiation process from hPSCs to PPs and chemical screen for PP expansion. (B) Flowchart of the chemical screening process. After replication and confirmation, I-BET151 was found as the hit compound. (C) Chemical structure of I-BET151. (D) Representative immunofluorescent staining of PPs treated with or without I-BET151 for PDX1, NKX6.1, and nuclei. Scale bar, 100 μm. (E and F) Representative flow cytometry dot plots (E) and population percentages (F) of cells stained for PDX1 and NKX6.1. N = 6. (G) RT-qPCR analysis of NKX6.1, PDX1, HNF6, and SOX9 gene expression in PPs treated with or without I-BET151. N = 3. (H) Volcano plot of differentially expressed genes (|log2FC| > 1, FDR < 0.05) in samples treated with I-BET151 versus dimethyl sulfoxide (DMSO). Red, up-regulated genes (620 genes); blue, down-regulated genes (2209 genes). X and Y axes represent log2(counts + 1). (I) GO terms of up-regulated and down-regulated genes in samples treated with I-BET151 versus DMSO. (J) Heatmap of differentially expressed genes in samples treated with I-BET151 versus DMSO. (K) I-BET151 strengthened the gene regulatory network of PPs (lines, the square of two genes’ expression’s Pearson correlation coefficient > 0.7; red lines, positive coexpression; blue lines, negative coexpression). Circle, PP marker genes; square, genes in Notch signaling pathway; triangle, cell cycle–related genes; octagon, EP markers. All data are expressed as means ± SD. Statistical significance was calculated using two-tailed Student’s t test, *P < 0.05, **P < 0.01, ***P < 0.001, and ****P < 0.0001.

