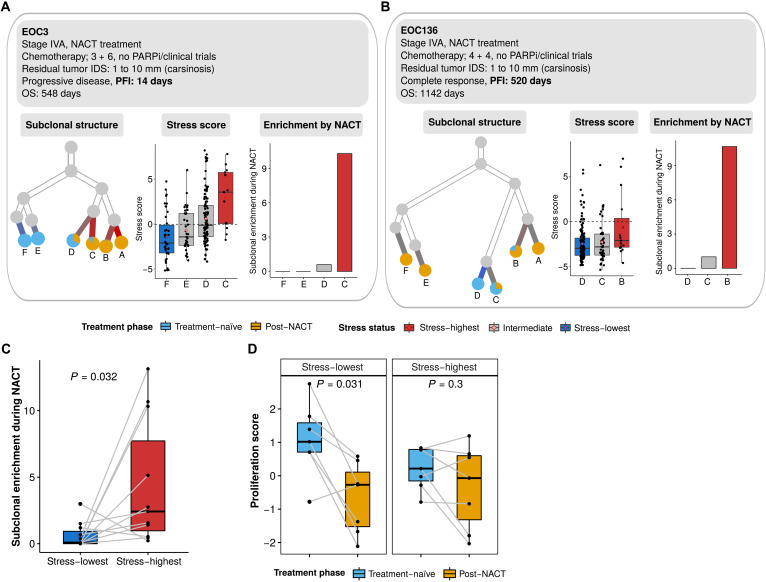
Fig. 4. Inferred CNA and subclonal analysis reveals enrichment of the stress state during chemotherapy.
(A) Inferred clonality tree (left), subclonal stress score (middle), and subclonal enrichment during NACT (right) of a representative patient (EOC3) with progressive disease and short PFI (PFI = 14 days). Only subclones that existed in the treatment-naïve samples are included in the subclonal stress score and subclonal enrichment analysis. The subclonal enrichment is measured by the ratio of the relative abundance of post-NACT cells against the relative abundance of treatment-naïve cells. PARPi, PARP inhibitor. (B) Inferred clonality tree (left), subclonal stress score (middle), and subclonal enrichment during NACT (right) of a representative patient (EOC136) with progressive disease and long PFI (PFI = 520 days). (C) Boxplot showing the enrichment of the stress-highest (red) and stress-lowest (blue) CNA subclones during NACT. Only subclones existing in treatment naïve samples (paired Wilcoxon rank-sum test, P = 0.032) were included. Each dot represents a CNA subclone. (D) Boxplots showing the proliferation score of the stress-highest (left; paired Wilcoxon rank-sum test, P = 0.031) and stress-lowest (right; paired Wilcoxon rank-sum test, P = 0.3) CNA subclones before and after chemotherapy. Each dot represents a CNA subclone.

