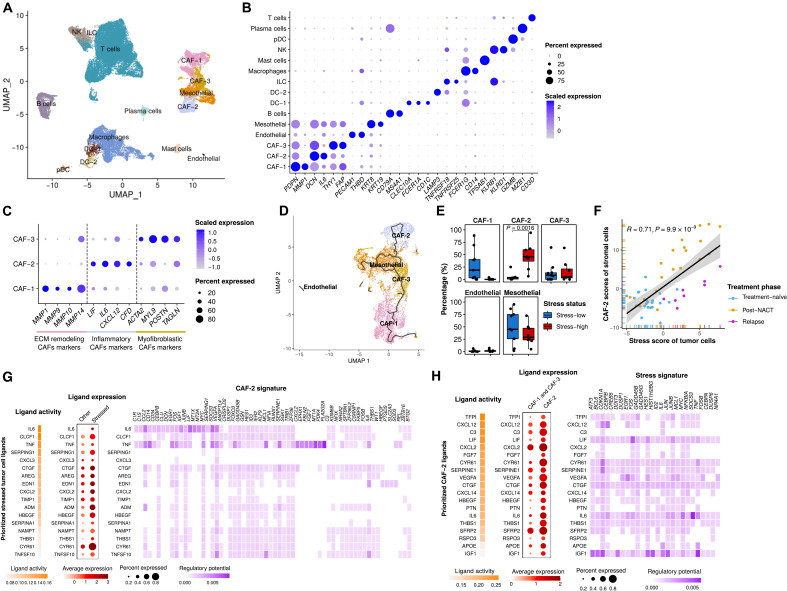
Fig. 6. Interactions between inflammatory stroma and stress-associated cancer cells.
(A) UMAP plot of stromal and immune cells, colored by cell type. (B) Dot plot showing the relative expression of acknowledged stromal and immune cell subtype markers. The color intensity scale reflects the average gene expression, and the size scale indicates the percentage of cells expressing the gene within that cell type. (C) Dot plot showing the expression of selected marker genes of CAF subtypes. ECM, extracellular matrix. (D) UMAP plot of stromal cells, colored by cell type. The trajectory learned by Monocle3 is displayed. (E) Boxplots showing the fractional differences (Wilcoxon rank-sum test) of identified stromal subtypes between stress-high (red) and stress-low (blue) tumors. Each dot represents a tumor sample. All differences with FDR-adjusted P < 0.05 are indicated. (F) Scatter plot showing the correlation between the tumor compartment stress score and the stromal compartment CAF-2 scores in HERCULES cohort. Each dot represents a sample, colored by treatment phase. (G) Heatmaps and dot plots showing the activity (left), expression (middle), and regulatory potential (right) of the prioritized ligands in stressed cancer cells that drive the phenotype of the inflammatory stroma (CAF-2). (H) Heatmaps and dot plots showing the activity (left), expression (middle), and regulatory potential (right) of the prioritized ligands in inflammatory stroma (CAF-2) that drive the stress signature in the stressed cancer cells.

