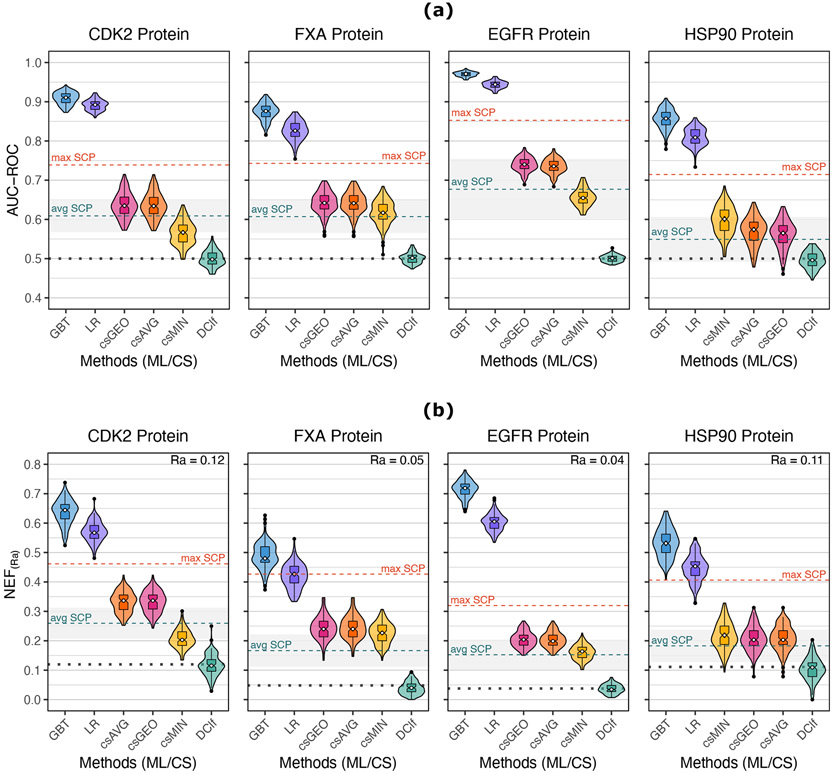
Figure 2:
Results from the 30×4cv analysis. (a) AUC-ROC values. (b) NEF values. Violin boxplots showing the distribution of the performance values of each SBVS method across the 30 repetitions. The white points within the boxes indicate the value of the median, and the notches represent the 95% confidence interval around it. Outliers are shown as black points. The max SCP (single-conformation performance) and the avg SCP dashed lines indicate the maximum and the average performance, respectively, achieved by a single conformation using the raw docking scores from the 120 × n validation sets generated during the 30×4cv analysis. The translucent gray area surrounding the avg SCP value represents one standard deviation from the average SCP. The dotted black lines indicate the expected performance of a random classifier.

