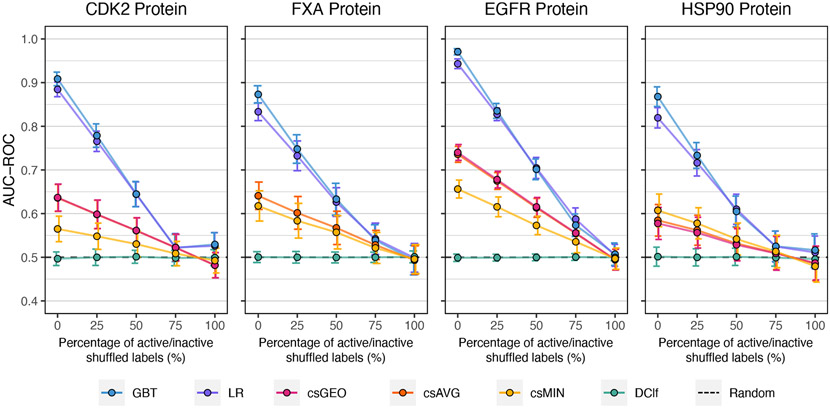
Figure 3:
Results of the y-randomization test showing the SBVS methods’ average AUC-ROC values at different percentages of active/inactive shuffled labels. Error bars indicate standard deviations. The csAVG and csGEO strategies had practically the same average and standard deviation values. Results of the NEF metric are shown in Figure S9.

