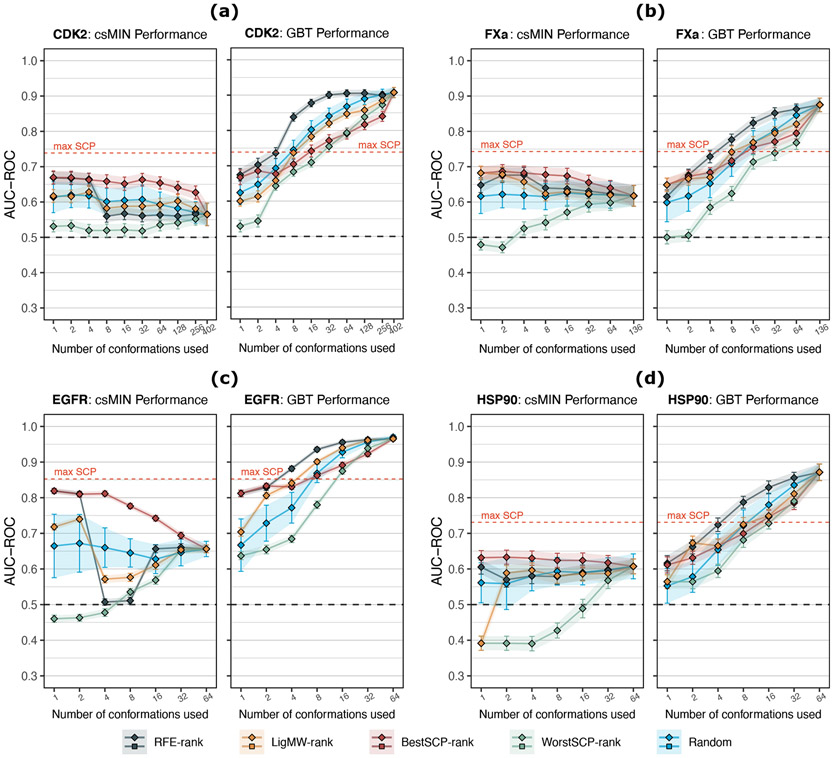
Figure 4:
Comparison between the average performance (AUC-ROC) of the csMIN (squares) and the GBT ML classifier (diamonds) using only k protein conformations. Five different selection criteria are compared. Error bars indicate standard deviations. As a reference, the max SCP dashed line indicates the maximum performance achieved by a single conformation using the raw docking scores from the 120 × n validation sets generated during the 30×4cv analysis, where all n conformations were considered. (a) CDK2 protein results. (b) FXa protein results (k = 128 values are omitted for clarity). (c) EGFR protein results. (d) HSP90 protein results. An extended version of these results can be consulted in Figure S10 and S11.

