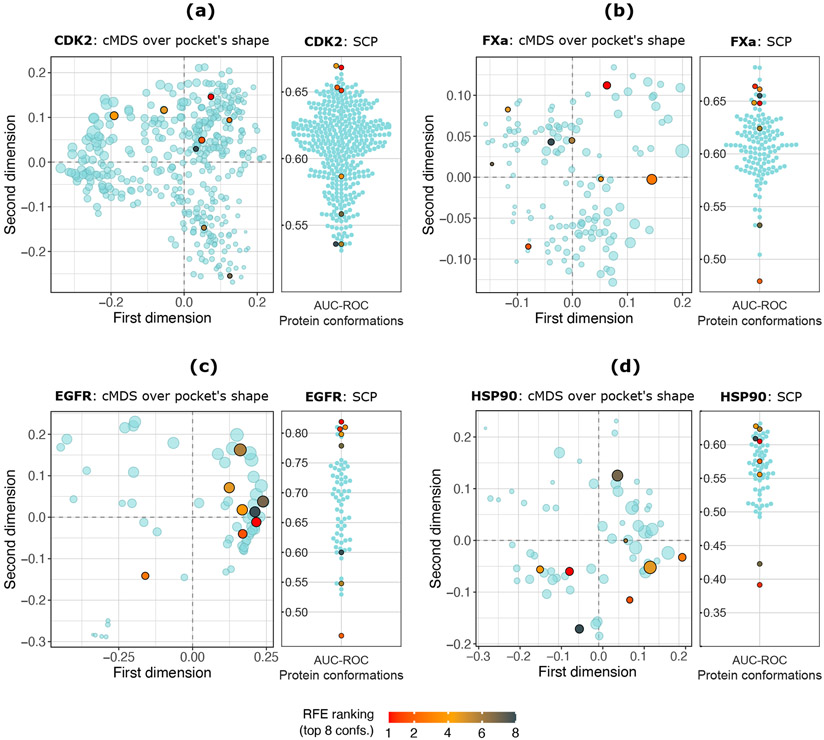
Figure 5:
Top 8 (red orange to black points) protein conformations selected by the RFE procedure using GBT as a base estimator. (a) CDK2 protein: 402 conformations. (b) FXa protein: 136 confs. (c) EGFR protein: 64 confs. (d) HSP90 protein: 64 confs. Left panels: Classical Multidimensional Scaling (cMDS) over the protein pocket’s shape. Each point represents a protein conformation. The point’s size is proportional to the protein pocket’s volume, computed by POVME3. Additional cMDS projections using Cα RMSD values are shown in Figure S13. Right panels: Swarm plots showing the SCP (AUC-ROC) value obtained by each protein conformation according to its performance using the raw docking scores from the whole dataset. The top eight RFE-rank conformations are colored from red to black according to their rank position.

