Figure 1. Schematic summary of the automatic mitochondrial copy (AutoMitoC) pipeline.
The AutoMitoC pipeline is comprised of four major steps: (i) preprocessing, (ii) background correction, (iii) detection of probe cross-hybridization, and (iv) final derivation of mitochondrial DNA copy number (mtDNA-CN) estimates. First, preprocessing is simplified by restricting analysis of autosomal variants to those that have low minor allele frequency ( <0.01) and low genotype missingness ( <0.05). For probes passing quality control, MT and autosomal log2ratio (L2R) values undergo an initial correction for guanine cytosine (GC) waves using the method by Diskin et al., 2008. Samples exhibiting high genomic waviness post GC-correction (L2R SD >0.35) are removed. Second, background correction consists of performing principal component analysis of the autosomal probe L2R values and finding the top k principal components (PCs) that correspond to the ‘elbow’ of the scree plot. In our case, ~70% variance in autosomal L2R values was explained by the top k PCs in both UKbiobank and INTERSTROKE datasets. GC-corrected MT and L2R values are then further adjusted for the top autosomal PCs (representing technical background noise) by taking the residuals of the association between the L2R values versus the k autosomal PCs. Third, we derive a ‘clean’ set of autosomal and MT probes without signs of off-target probe cross-hybridization by empirically testing the GC-corrected and background-corrected L2R values for association with either the sample medians of off-target genome L2R values or self-reported gender (to capture off-target hybridization to sex chromosomes). Fourth, using the ‘clean’ probeset, we repeat the autosomal background correction, extract the top MT PC as a crude measure of mtDNA-CN, change the sign of the MT PC according to association of the MT PC with known predictors of mtDNA-CN that are commonly reported (sex or age), and last, standardize the MT PC values as the final AutoMitoC estimate.

Figure 1—figure supplement 1. Intuition behind differentiation of genotypes and determination of mitochondrial DNA copy number (mtDNA-CN).
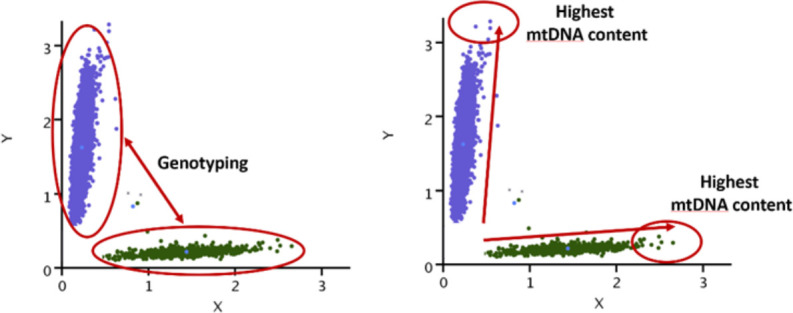
Figure 1—figure supplement 2. Overview of the MitoPipeline (Source: http://genvisis.org/MitoPipeline/) (Lane, 2014).
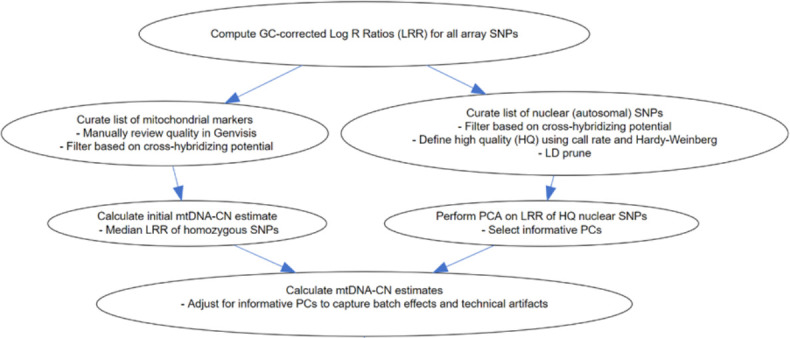
Figure 1—figure supplement 3. Minor allele frequency (MAF)-stratified analyses demonstrating utility of rare vs common autosomal variants for signal normalization.

Figure 1—figure supplement 4. Distribution of log10 transformed coefficients of determination (r2) from the association between autosomal probe intensities and median mitochondrial (MT) signal with (blue) or without (red) correction for background noise (i.e. 120 autosomal principal components [PCs]).
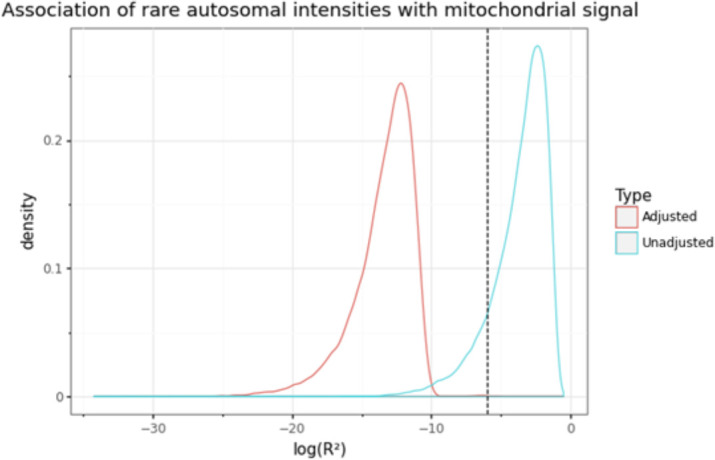
Figure 1—figure supplement 5. Validation of automatic mitochondrial copy in an ethnically diverse cohort with qPCR measurements.
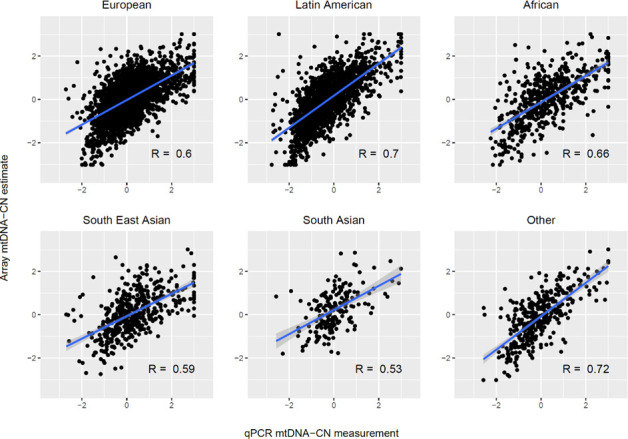
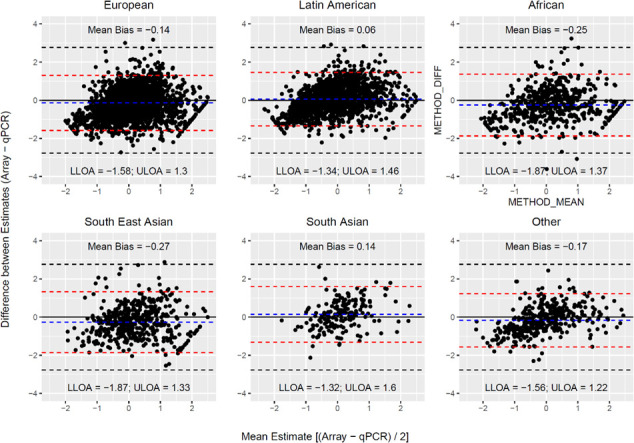
Figure 1—figure supplement 6. Bland Altman plots illustrating the extent of agreement between array and qPCR measurements.