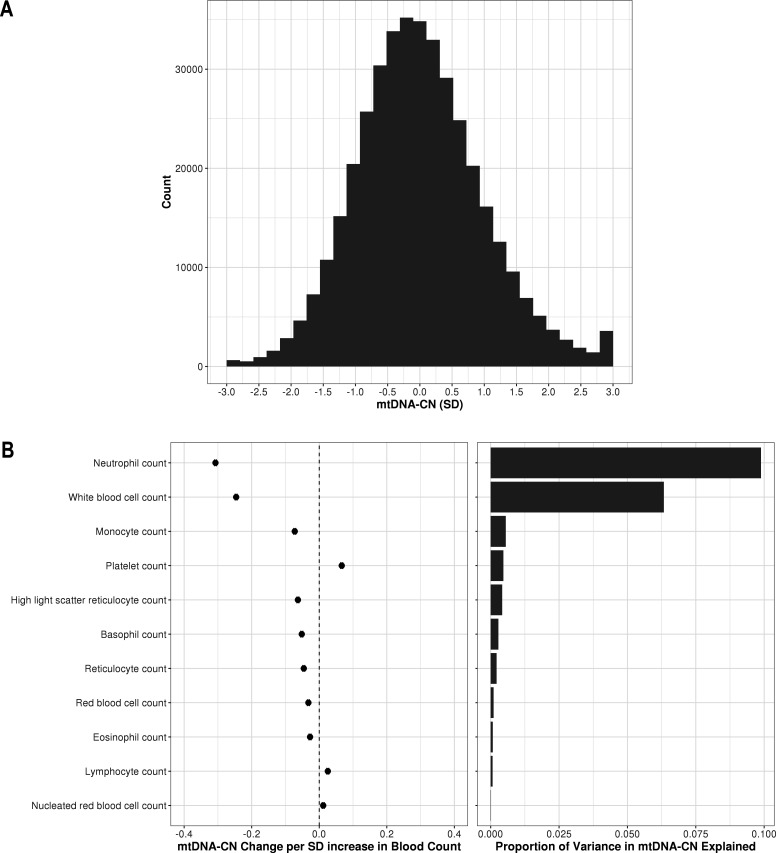
Figure 2. Distribution of automatic mitochondrial copy (AutoMitoC) estimates and the influence of blood cell counts.
(A) Histogram illustrating AutoMitoC mitochondrial DNA copy number (mtDNA-CN) estimates in 395,781 UKBiobank participants expressed per SD change in mtDNA-CN. Associations between blood cell counts with mtDNA-CN levels as conveyed by forest plots illustrating effect estimates (left) and a bar plot showing the proportion of variance in mtDNA-CN explained (right). Models were adjusted for age, age2, sex array type, 20 genetic principal components, and ethnicity. Both blood cell counts and mtDNA-CN levels were standardized (mean = 0; SD = 1).

