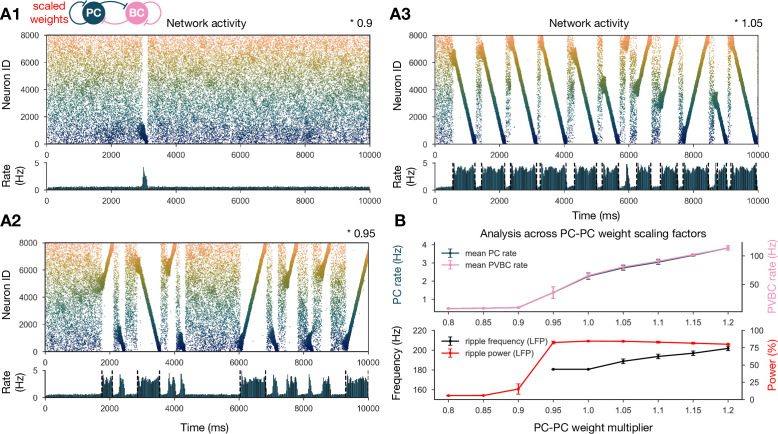
Figure 3. Sharp waves, ripple oscillations, and replay are robust with respect to scaling the recurrent excitatory weights.
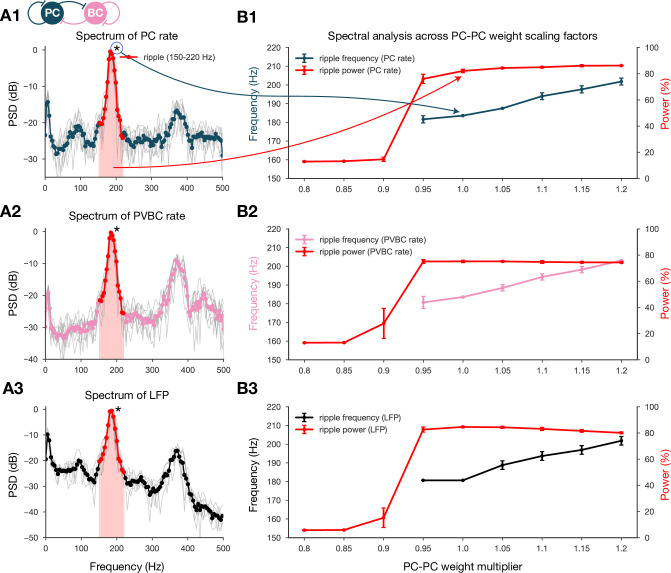
(A) Pyramidal cell (PC) raster plots on top and PC population rates at the bottom for E-E scaling factors 0.9 (A1), 0.95 (A2), and 1.05 (A3). (Scaling factor of 1.0 is equivalent to Figure 2A.) Dashed vertical black lines have the same meaning as in Figure 2A. (B) Analysis of selected indicators of network dynamics across different E-E weight scaling factors (0.8–1.2). Mean PC (blue) and parvalbumin-containing basket cell (PVBC) (pink) population rates are shown on top. The frequency of significant ripple oscillations (black) and the percentage of power in the ripple frequency range (red) in the estimated local field potential (LFP) is shown at the bottom. Errors bars indicate standard deviation and are derived from simulations with five different random seeds. See also Figure 3—figure supplement 1.


