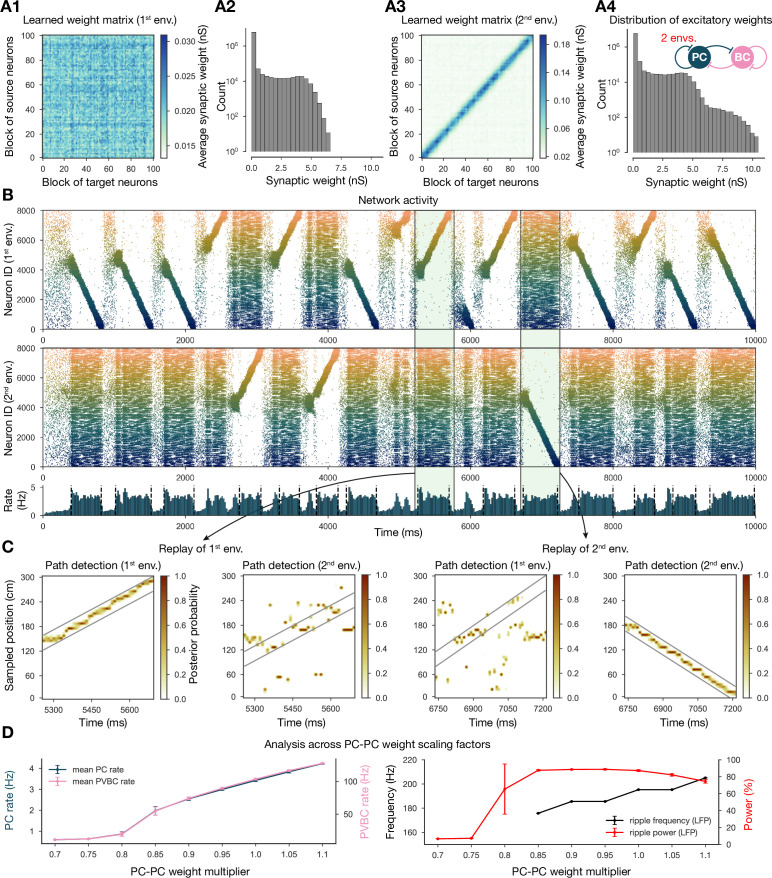
Figure 4. Two distinct environments can be learned and replayed by the network.
(A) Learned excitatory recurrent weight matrices. (A1) Weights after learning the first environment. Note that the matrix appears random because neurons are arranged according to their place field location in the second environment, which has not been explored at this point. (A3) Weights after learning in the second environment. (A2, A4) Distribution of nonzero synaptic weights in the learned weight matrices in (A1) and (A2), respectively. (B) Pyramidal cell (PC) raster plots: in the top panel, neurons are ordered and colored according to the first environment; in the middle panel, neurons are ordered and colored according to the second environment; and PC population rate is shown at the bottom (see Figure 2A) from a simulation run with 0.9* the modified weight matrix shown in (A3). (C) Posterior matrices of decoded positions from spikes (see Figure 1E) within two selected high-activity periods (8th and 10th from B). From left to right: decoding of replay in first environment (eighth event from B) according to the first (significant) and second environment; decoding of replay in second environment (10th event from B) according to the first and second (significant) environment. (D) Analysis of selected network dynamics indicators across different E-E weight scaling factors (0.7–1.1) as in Figure 3B.

