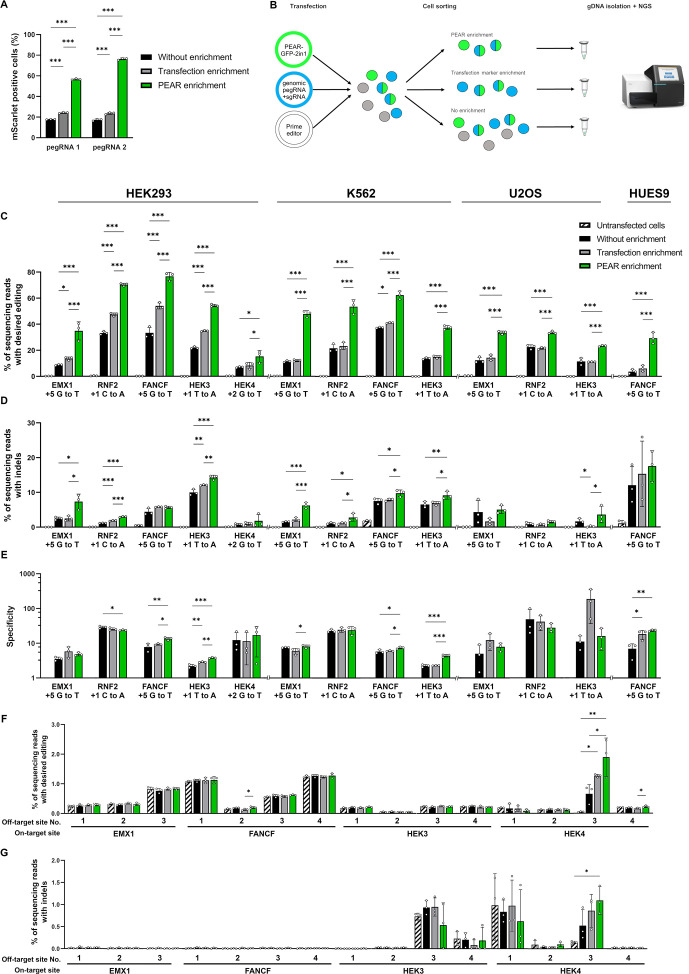
Figure 3. PEAR enriches prime edited cells.
(A) Flow cytometry measurements of prime edited (i.e., mScarlet positive) cells in the HEK-BEAR-mScarlet cell line. The PEAR-GFP plasmid was co-transfected with PE protein-coding plasmid, two pegRNAs targeting either the plasmid or the genomic PEAR sequences and an sgRNA (for complementary strand nicking at position +112). To edit the PEAR-GFP plasmid, two efficient pegRNAs were selected from a previous experiment (Figure 1B) (pegRNA 1 and pegRNA 2 are those shown in Figure 1B with an RT of 24 and a PBS of 10 nucleotides, and an RT of 33 and a PBS of 10 nucleotides, respectively). The mScarlet positive cell count was gated for either all live single cells (no enrichment, black bars); for BFP-positive cells (transfection enrichment, gray bars); and for GFP-positive cells (PEAR enrichment, green bars). (B) Schematic workflow of PEAR enrichment experiments. Various cell lines were co-transfected with PEAR-GFP-2in1, a pegRNA, and a complementary nicking sgRNA targeting a genomic sequence (the latter two carrying a BFP expression cassette to monitor transfection efficiency), and the PE2-encoding plasmid. Cells expressing GFP, BFP, or both are represented as green, blue or half green/half blue circles, respectively. Cells not expressing these fluorescent proteins are shown in gray. Three days after transfection, cells were sorted into three fractions: single living cells, cells expressing BFP, and cells expressing GFP. After purification of genomic DNA and PCR amplification of the targeted amplicon, the percentage of editing was determined by NGS from each sorted sample. (C–E) The PEAR-GFP-2in1 plasmid and endogenous genomic targets were co-edited in HEK293T, K562, U2OS, and HUES9 cells. Cells were enriched and analyzed as described in (B). Results from cells without enrichment are shown in black, transfection enrichment in gray, PEAR enrichment in green, and untransfected cells in striped black and white. Precise prime editing (C) and unwanted indel formation (D) were quantified from the same samples. Specificity (prime editing%/indel%) was calculated separately for each sample (E). Columns represent means ± SD of three parallel transfections (white circles). When indel% was below the detection limit of NGS, specificity was calculated with 0.05% indel to avoid falsely high specificity values. Differences between samples were tested using one-way ANOVA. Only statistically significant differences are shown, differences to untransfected cells are not shown. *p<0.05, **p<0.01, ***p<0.001. (F, G) Off-target prime editing (F) and indel formation (G) were analyzed for known off-targets of target sites from (C) and (D) in HEK293T cells. Columns represent means ± SD of three parallel transfections (white circles). Differences between samples were tested using one-way ANOVA. Only statistically significant differences are shown. *p<0.05, **p<0.01, ***p<0.001. For all measured values, applied statistic tests and exact p values see Figure 3—source data 1. BEAR, base editor activity reporter; PEAR, prime editor activity reporter.


