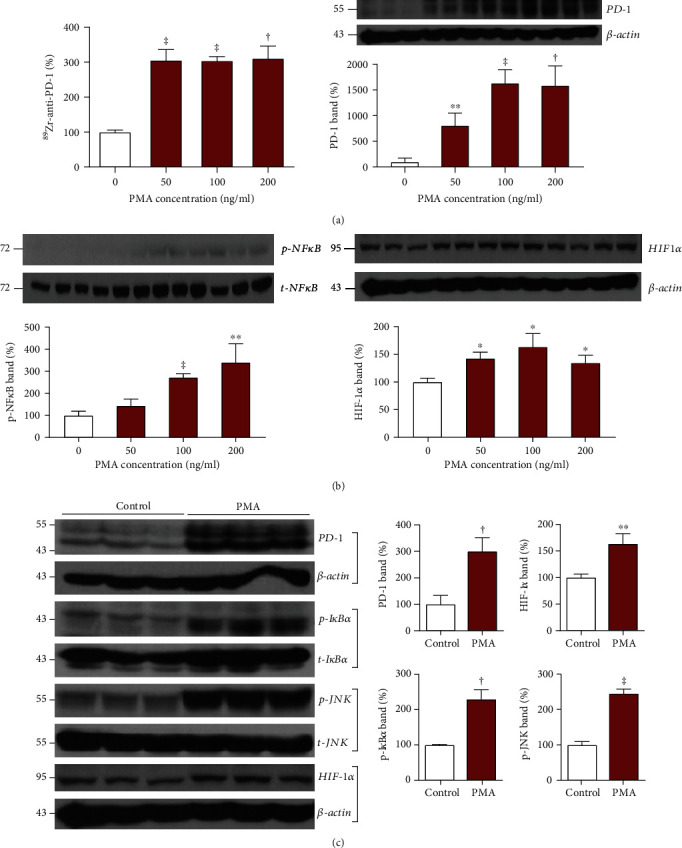
Figure 3.

Effects of PMA stimulation on cultured EL4 cells. (a) Effects of 24 h treatment with graded doses of PMA on 89Zr-PD-1 IgG binding (left) and PD-1 immunoblots with β-actin-corrected band intensities (right). (b) Effects of graded doses of PMA on Western blots of p-NFκB (left) and HIF-1α (right) with quantified protein band intensities that are corrected by controls. (c) Immunoblots of PD-1, HIF-1α, p-IκBα, and p-JNK with quantified protein band intensities corrected by controls at baseline and following 24 h treatment with PMA. All bars represent the mean ± SD of triplicate samples per group. ∗P < 0.05, ∗∗P < 0.01, †P < 0.005, and ‡P < 0.001.
