Figure 3.

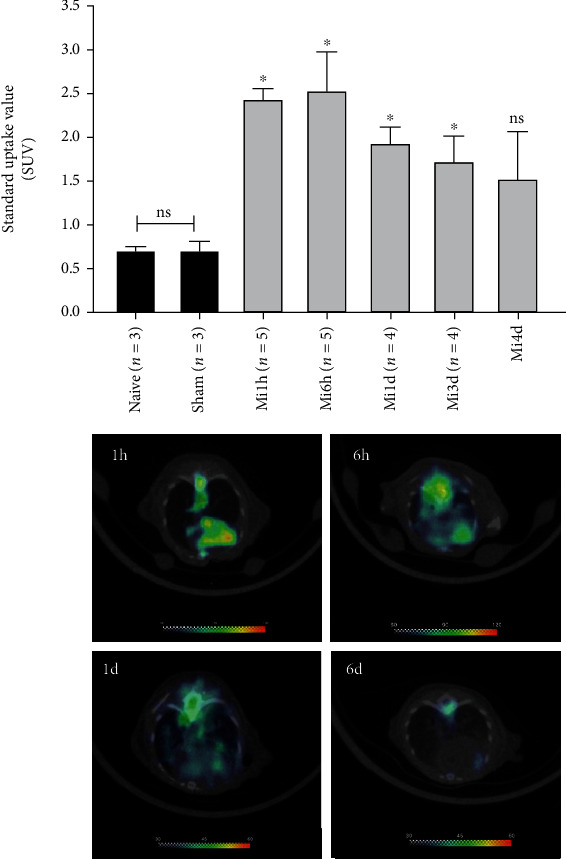
Cardiac SUV of 18F-FGA at various times after MI (mean ± sem; ∗p < 0.05 vs. sham). The lower panel shows representative tomograms of mice imaged after 1 h, 6 h, 1 d, and 3 d after MI.

Cardiac SUV of 18F-FGA at various times after MI (mean ± sem; ∗p < 0.05 vs. sham). The lower panel shows representative tomograms of mice imaged after 1 h, 6 h, 1 d, and 3 d after MI.