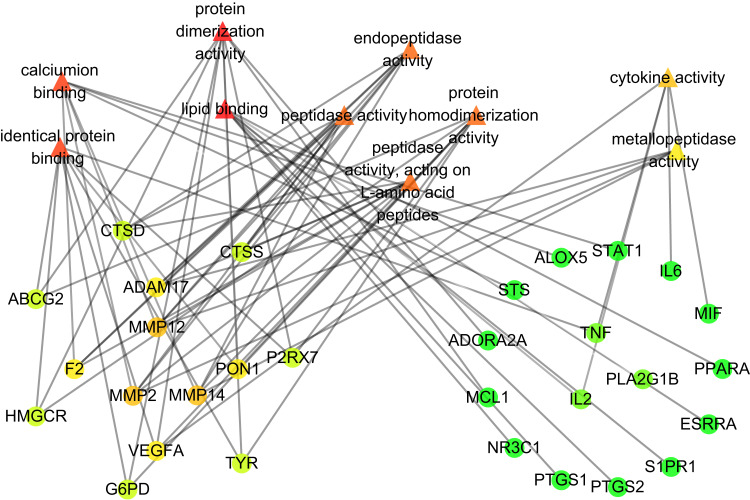
Figure 6.
PPI network of key targets of MF.
Notes: The circle represents the target point, and the gray line represents the degree value of the node, the degree value from large to small follows a gradient from orange to green. The more lines, the greater the degree value which in turn indicates the greater the biological importance.

