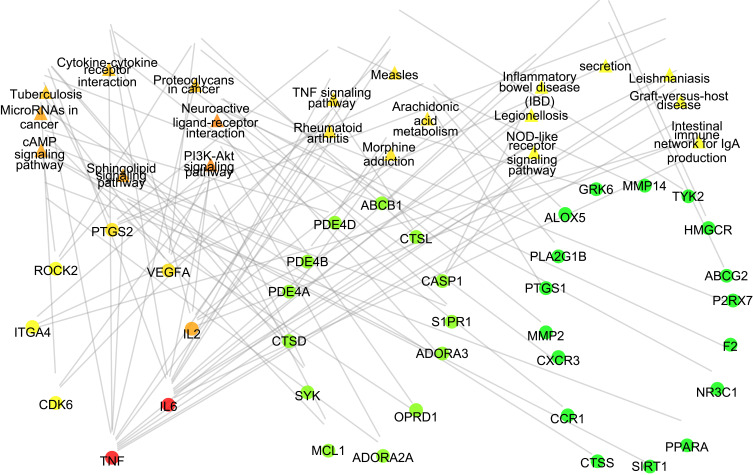
Figure 10.
PPI network of key targets of KEGG analysis.
Notes: the triangles represent Pathway, the circle represents the target, the target in the figure is gradient from orange to green according to the degree value from large to small. The more lines, the greater the degree value indicates the greater its biological importance.

