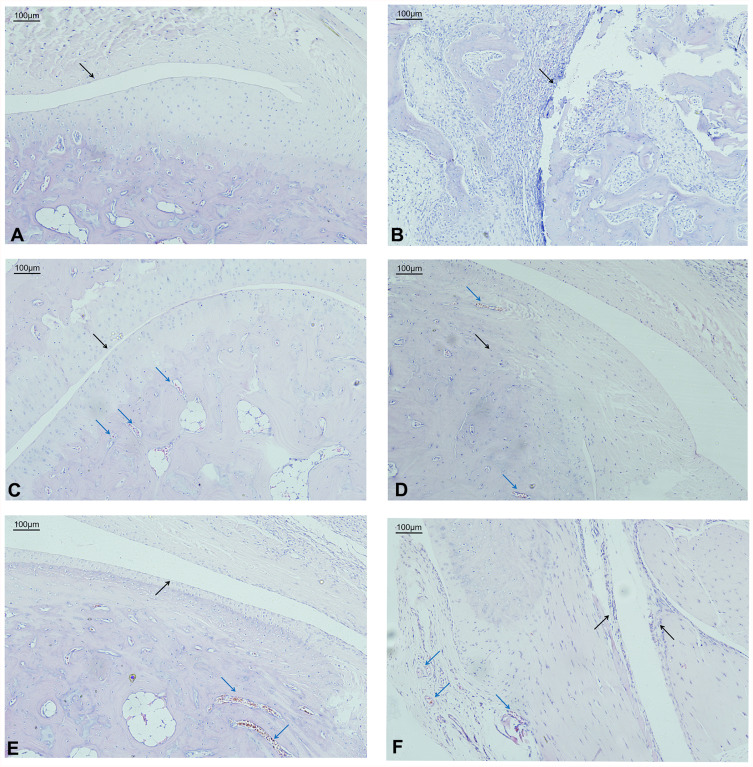
Figure 13.
Histology of healthy and CIA rat synovium. Representative pictures of joint sections from non-induced (A) or CIA-induced rats (B–F), non-treated (A and B) or treated with GTW (C) or SX (D–F). The sections were stained by H&E (100X). (A), Nor group; (B), Mod group; (C), GTW group; (D), SX 40 g/kg group; (E), SX 20 g/kg group; (F), SX 10 g/kg group. Magnification: 100×.
Notes: Black arrows show synovial inflammatory cell infiltrates and hyperplasia; red arrows show newly formed blood vessels.

