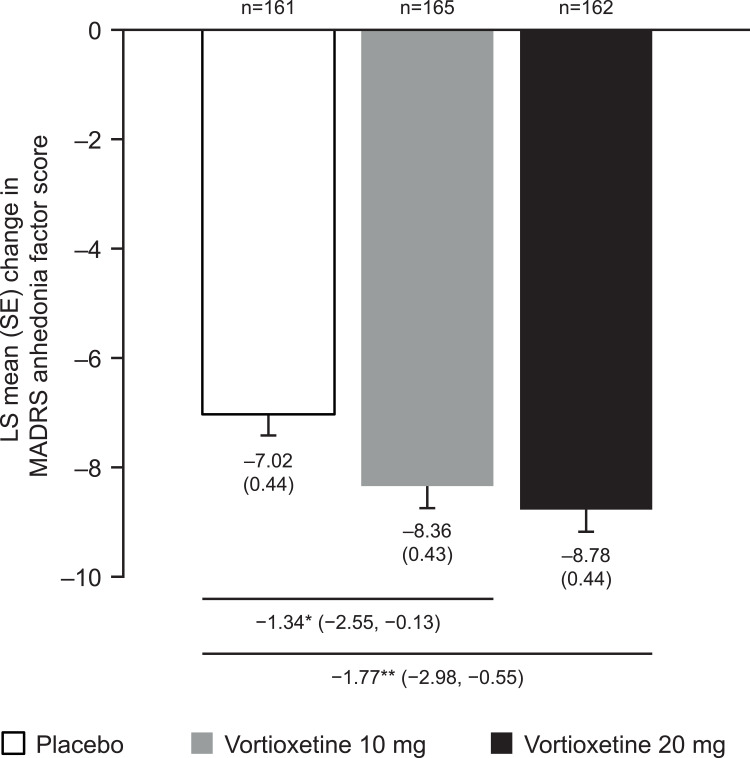
Figure 1.
Change from baseline to week 8 (LOCF) in MADRS anhedonia factor score. *P<0.05, **P<0.01. Data are LS mean (SE) change in MADRS anhedonia factor score and LS mean difference versus placebo (95% CI). MADRS anhedonia factor is derived from the sum of the following items: Q1, apparent sadness; Q2, reported sadness; Q6, concentration; Q7, lassitude; and Q8, inability to feel.
Abbreviations: CI, confidence interval; LOCF, last observation carried forward; LS, least-squares; MADRS, Montgomery–Åsberg Depression Rating Scale; SE, standard error.

