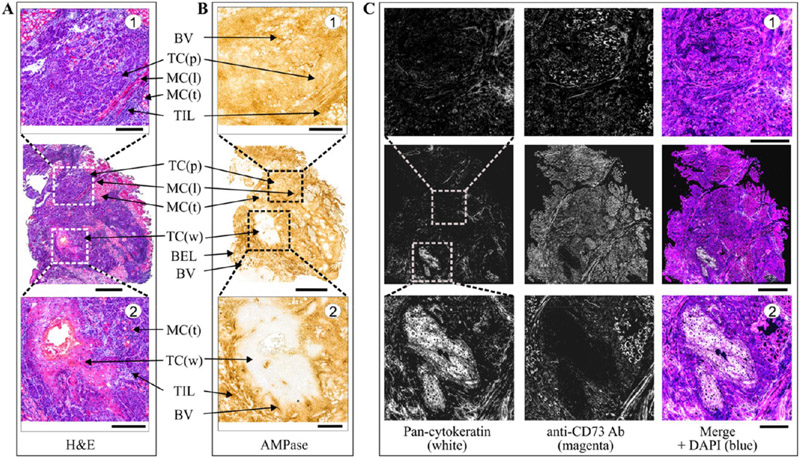
Figure 9.
Distribution of AMPase activity and the expression level of CD73 in the TME. A tumor was obtained from the patient with squamous cell carcinoma of mobile tongue. (A) Staining of tissue cryosections with H&E enabled the visualization of the malignant and benign cells in the TME. (B) Tissue-specific distribution of AMPase activity determined by incubating the slides with 100 μM AMP in the presence of Pb(NO3)2 followed by microscopic detection of the nucleotide-derived inorganic phosphate (Pi) as a brown precipitate. (C) For immunofluorescence staining, tumor sections were stained with the anti-CD73 antibody, together with Alexa Fluor-488-conjugated pan-cytokeratin mAb serving as a marker of well-differentiated epithelial tumor cells. Single channels are shown in grayscale, and the right-hand panels display merged images with nuclei counterstained with DAPI. Abbreviations: BEL, basal epithelial layer; BV, blood vessels; MC(l), muscular cells (longitudinally oriented); MC(t), muscular cells (transverse orientation); TC(p), tumor cells (poorly differentiated); TC(w), tumor cells (well differentiated); TIL, tumor-infiltrating leukocytes. Scale bars are 1 mm (A–C) and 300 μm (top and bottom insets).

