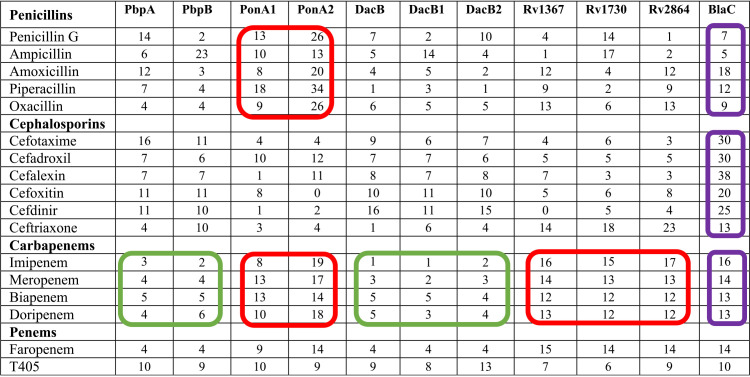
TABLE 1.
Hydrolysis (%) of individual β-lactam by M. tuberculosis PBPsa
The amount of each β-lactam that is hydrolyzed by a PBP as a percentage of the total amount of β-lactams in each subclass hydrolyzed by all PBPs is shown. Reaction conditions such as buffer, protein and β-lactam concentrations, temperature, time course, etc. were identical for all PBP-β-lactam pairs. β-lactam subclasses that are more effectively or comparably hydrolyzed by PBPs relative to BlaC are circled in red. The subclasses that is least hydrolyzed by PbpA, PbpB, DacB, DacB1, and DacB2 are circled in green. Hydrolysis of these β-lactams by BlaC are circled in purple. Data for each PBP and β-lactam are included in Table S2.

