
Figure 4. NF-κB and STAT3 bind to VEGF-A promoter in an IL-1β-dependent manner, and inhibition of either led to decreased expression of pro-angiogenic VEGF-A165a and to increased expression of anti-angiogenic VEGF-A165b.
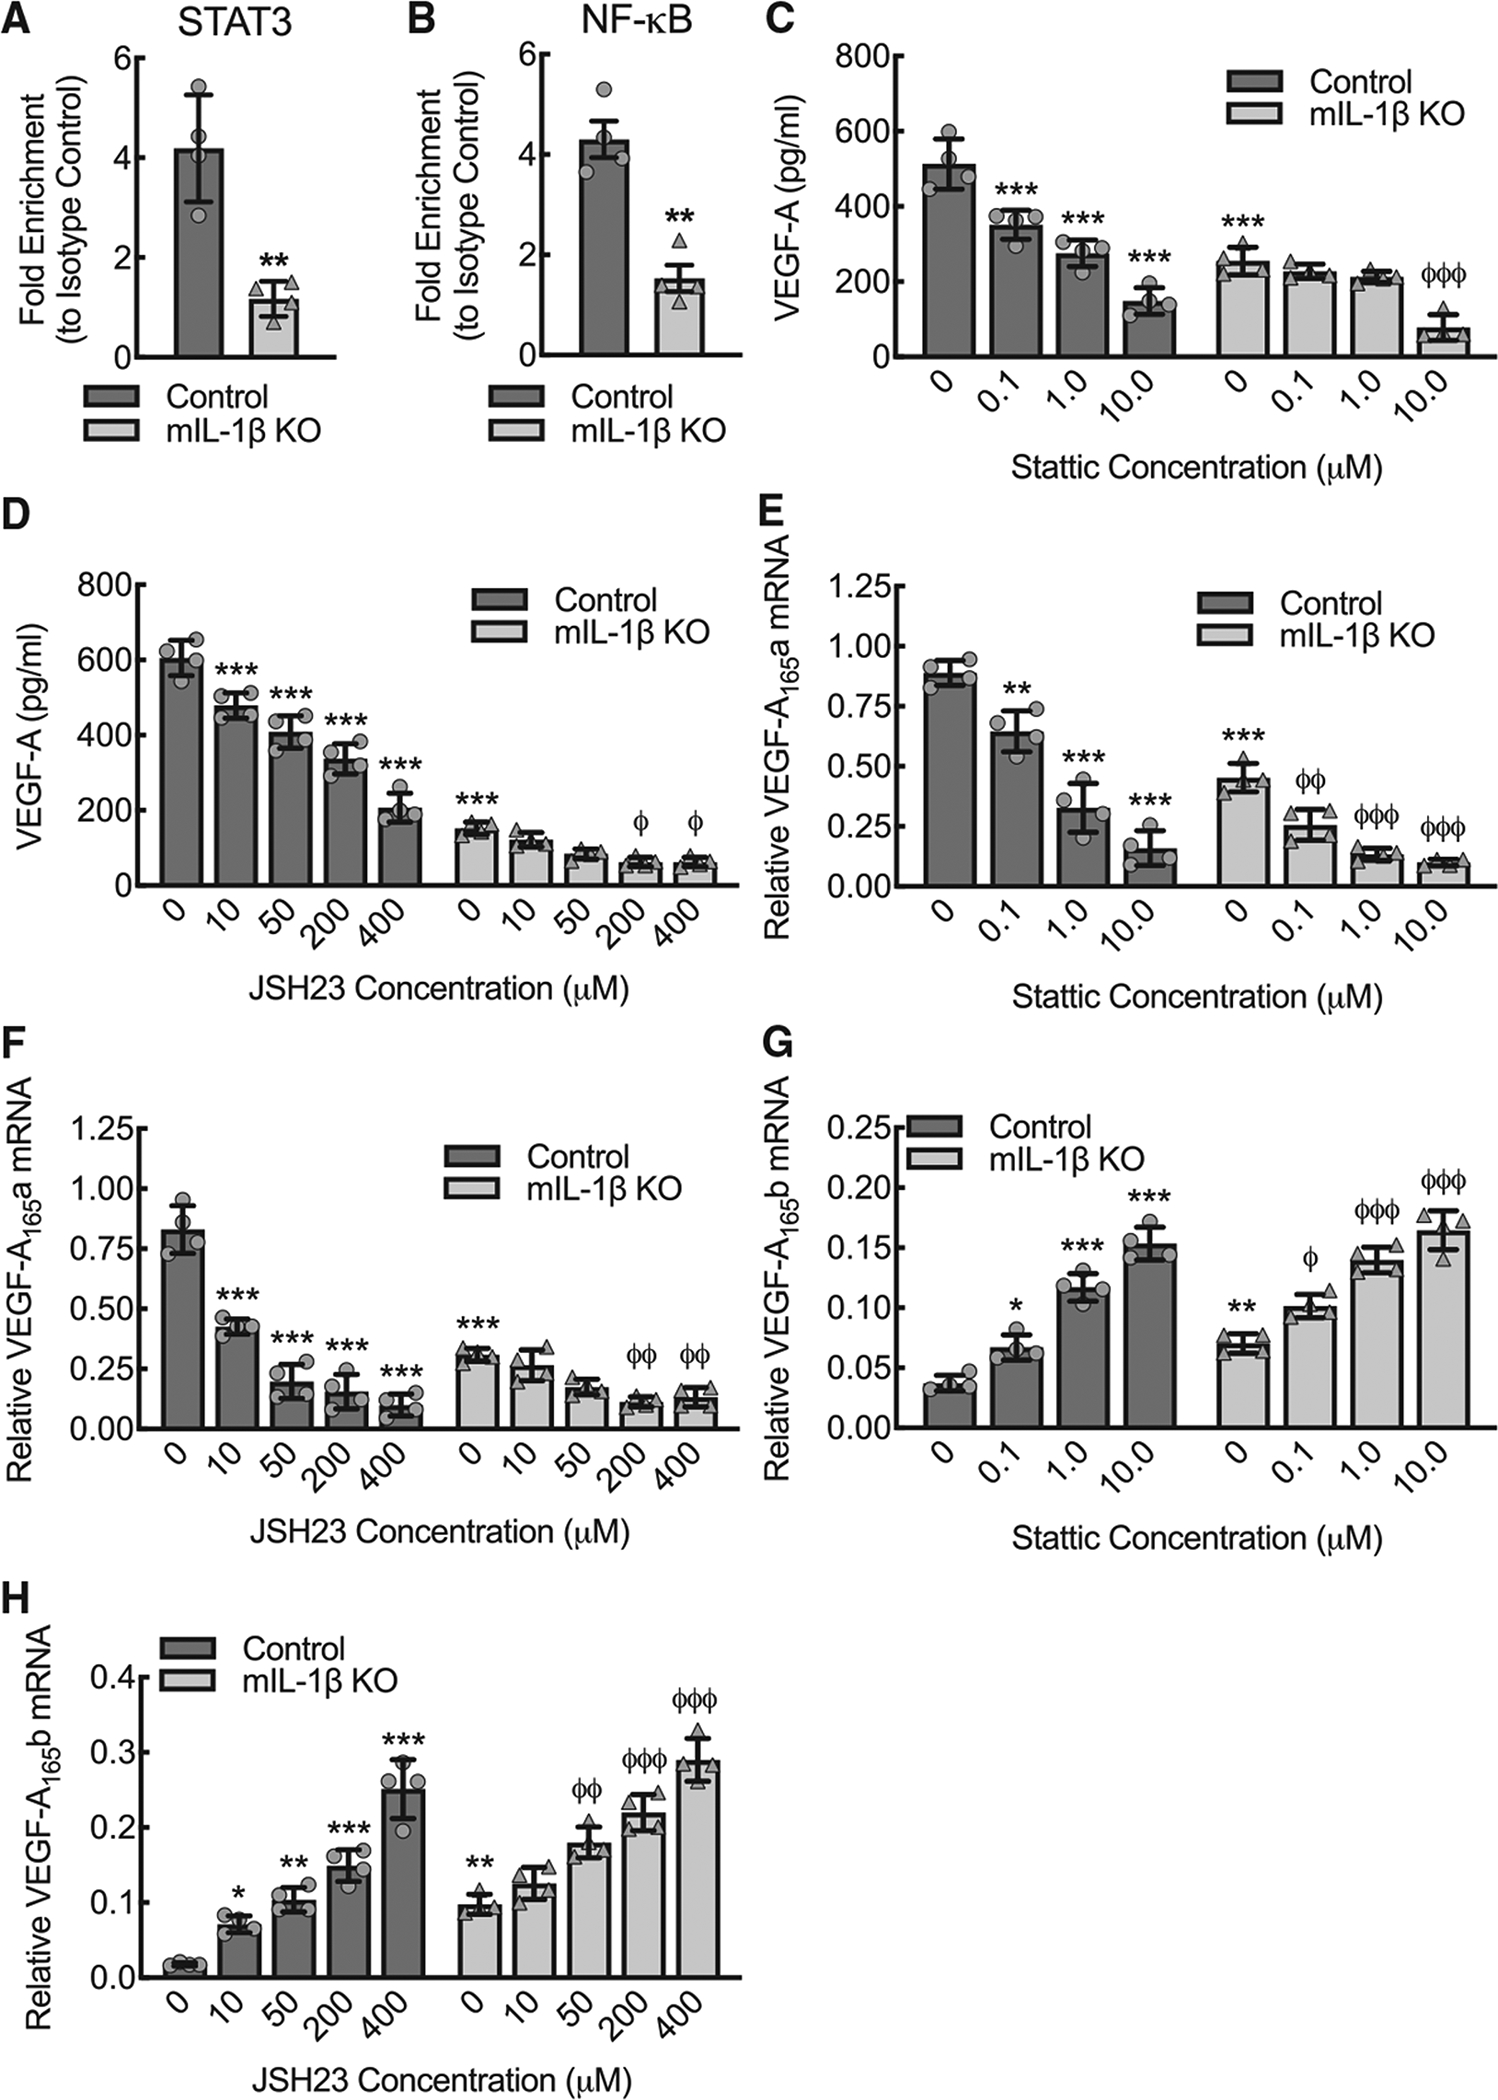
(A) Quantitative RT-PCR of the VEGF-A promoter after chromatin immunoprecipitation (ChIP), using antibody specific to STAT3 relative to isotype control, of lysate from control or myeloid IL-1β-deleted (mIL-1β KO) BMDMs that were treated with LPS+IFN-γ for 24 h (**, p < 0.001 by t test; n = 4 mice total, two males and two females).
(B) Quantitative RT-PCR of the VEGF-A promoter after ChIP, using antibody specific to NF-κB relative to isotype control, of lysate from BMDMs treated as in (A) (**, p = 0.0018 by t test; n = 4 mice total, two males and two females).
(C) BMDMs from control or mIL-1β KO were treated with LPS+IFN-γ for 24 h in the presence or absence of the STAT3 inhibitor, Stattic, at indicated concentrations, followed by ELISA for VEGF-A on culture supernatant (***, p ≤ 0.0001 compared to control at 0 concentration by ANOVA; φφφ, p ≤ 0.0001 compared to mIL-1β KO at 0 concentration by ANOVA; n = 4 mice total, twomales and two females).
(D) BMDMs from control or mIL-1β KO mice were treated with LPS+IFN-γ for 24 h in the presence or absence of the NF-κB inhibitor, JSH23, at indicated concentrations, followed by ELISA for VEGF-A on culture supernatant (***, p ≤ 0.0001 compared to control at 0 concentration by ANOVA; φ, p ≤ 0.01 compared to mIL-1β KO at 0 concentration by ANOVA; n = 4 mice total, two males and two females).
(E) BMDMs treated as in (C) followed by quantitative RT-PCR for relative VEGF-A165a mRNA expression (**, p < 0.001; ***, p ≤ 0.0001 compared to control at 0 concentration by ANOVA; φφ, p ≤ 0.005; φφφ, p ≤ 0.0001; compared tomIL-1β KO at0 concentration by ANOVA; n = 4 mice total, two males and two females).
(F) BMDMs treated as in (D) followed by quantitative RT-PCR for relative VEGF-A165a mRNA expression (***, p < 0.0001 compared to all others by ANOVA; φφ, p ≤ 0.005 compared to mIL-1β KO at 0 concentration by ANOVA; n = 4 mice total, two males and two females).
(G) BMDMs treated as in (C) followed by quantitative RT-PCR for relative VEGF-A165b mRNA expression (*, p < 0.05; **, p < 0.001; ***, p < 0.0001 compared to control at 0 concentration by ANOVA; φ, p < 0.05; φφφ, p ≤ 0.0001; compared to mIL-1β KO at 0 concentration by ANOVA; n = 4 mice total, two males and two females).
(H) BMDMs treated as in (D) followed by quantitative RT-PCR for relative VEGF-A165b mRNA expression (*, p < 0.05; **, p < 0.001; ***, p < 0.0001 compared to control at 0 concentration by ANOVA; φφ, p < 0.001; φφφ, p ≤ 0.0001; compared to mIL-1β KO at 0 concentration by ANOVA; n = 4 mice total, two males and two females). Data, mean ± SD.