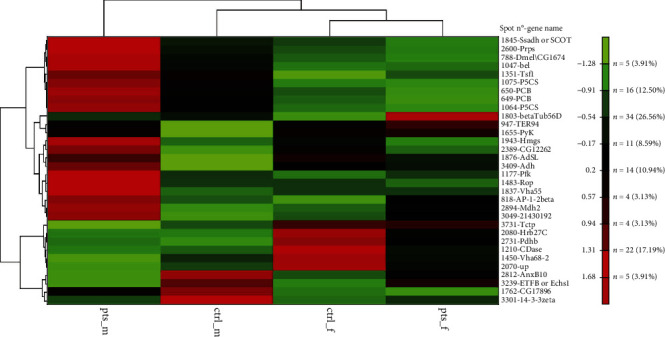
Figure 12.

Clustered heat map of differentially expressed proteins after PTS supplementation in female and male samples. Heat map was generated using NG-CHM GUI 2.20.2 software. Z-norm transform was used to normalize the row values (mean of normalized optical densities of spots, n =3) and resulting transform data matrix used to build the heat map. A hierarchical ordering method was applied to clustered rows and columns. Euclidean distance metric was applied to hierarchically clustered rows and columns. Data matrix distribution values range from -1.72 to +1.72. The brighter the color, the more intense the changes are. ctrl_m: male control; ctrl_f: female control; pts_m: males treated with PTS; pts_f: females treated with PTS.
