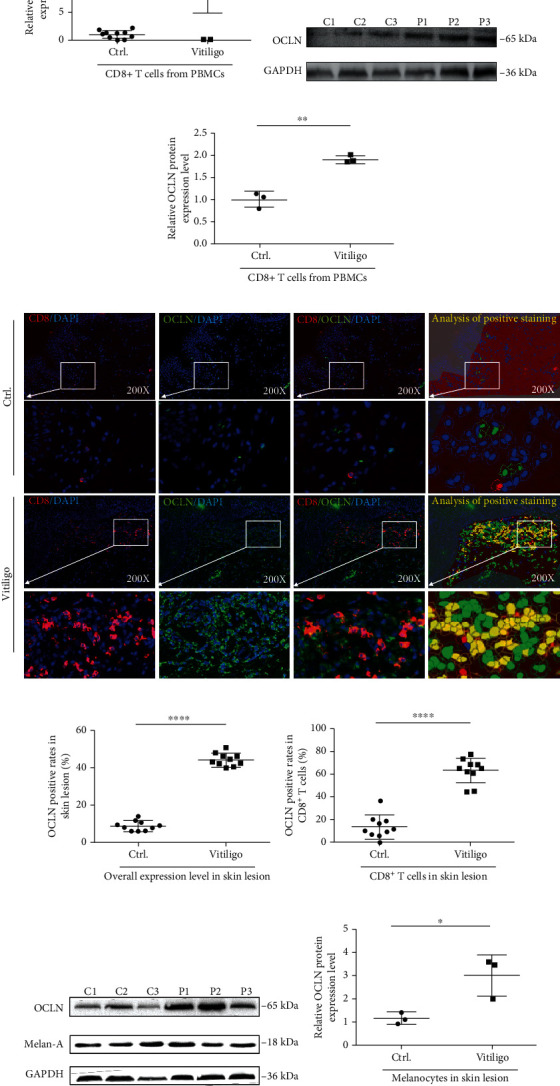
Figure 1.

(a) The mRNA expression level of OCLN in CD8+ T cells in the peripheral blood of normal people and patients with vitiligo (n = 10, ∗∗∗P < 0.001). (b, c) The protein expression level of OCLN in CD8+ T cells in the peripheral blood of normal people and patients with vitiligo (n = 3, ∗∗P < 0.01, C: control; P: patient). (d–f) The expression of CD8 and OCLN in normal skin and skin lesions of patients with vitiligo. (n = 10, ∗∗∗∗P < 0.0001, ∗∗∗∗P < 0.0001). The red mark represents CD8-positive staining, the green mark represents OCLN-positive staining, and the blue mark represents DAPI. The yellow mark of image analysis of positive staining represents the part where CD8 and OCLN are colocalized after analysis by Inform2.3 software. (g, h) The expression of OCLN in melanocytes from normal skin and skin lesions of patients with vitiligo (n = 3, ∗P < 0.05, C: control; P: patient).
