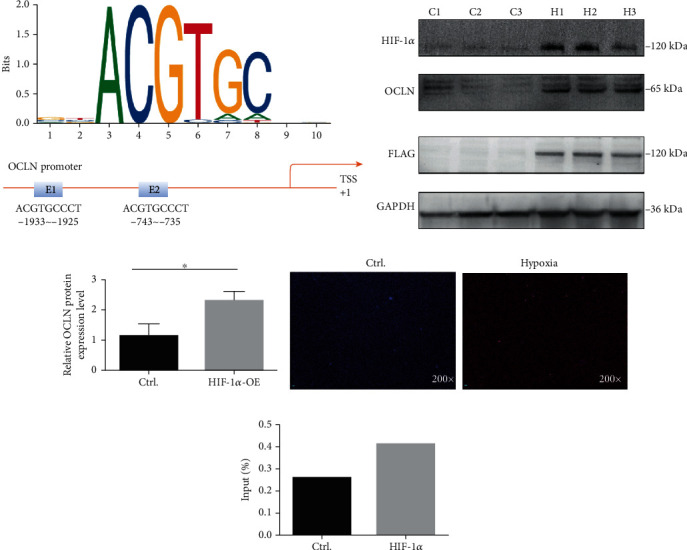
Figure 5.

(a) HIF-1α sequence and binding sites (E1 and E2) to the OCLN promoter region were predicted by using JASPAR database (http://jaspar.genereg.net/). (b, c) The protein expression levels of HIF-1α, OCLN, and FLAG in CD8+ T cells overexpressed with HIF-1α plasmid and normal control (n = 3, ∗P < 0.05, C: control; H: HIF-1α-OE). (d) ROS level of CD8+ T cells under normoxia and hypoxia. (e) HIF-1α ChIP-qPCR analyses of CD8+ T cells, fold change = 1.76.
