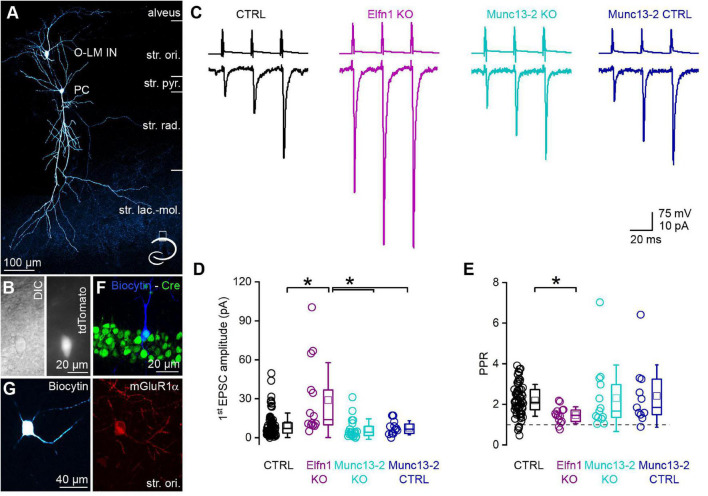
FIGURE 4.
Removal of Munc13-2 does not change the peak amplitude and short-term plasticity of unitary EPSCs between CA1 PCs and mGluR1α expressing INs. (A) In vitro whole-cell patch-clamp recorded and biocytin filled CA1 PC and O-LM IN. The axonal arbor of the IN is visible in the stratum lacunosum-moleculare. Cartoon depicts the location of the cells within the hippocampus. (B) DIC image of the O-LM IN shown in panel (A) (left) and fluorescent tdTomato signal of the same cell (right). (C) Unitary EPSCs (lower traces) evoked by a train of 3 APs @ 40 Hz in a presynaptic CA1 PC (upper traces) recorded in postsynaptic O-LM INs in the dorsal CA1 region of the hippocampus. Black traces are from a control, magenta traces from an Elfn1 knock-out, cyan traces from a Munc13-2 conditional knock-out, dark blue traces from a Munc13-2 conditional knock-out littermate control. (D) The first EPSC is significantly larger (*) in the Elfn1 knock-out mouse than in any of the controls or in the Munc13-2 conditional knock-out mice (p = 5.44 × 10⁻⁴, Kruskal-Wallis ANOVA, post hoc Dunn’s test: p = 0.003, 0.00024, 0.041, ctrl vs. Elfn KO, Elfn KO vs. Munc13-2 KO, Elfn KO vs. Munc13-2 ctrl, respectively) while there is no change in the peak amplitude in the Munc13-2 conditional knock-out mouse compared to any of the controls (Kruskal–Wallis ANOVA, post hoc Dunn’s test p = 0.49 and 1, ctrl vs. Munc13-2 KO, control vs. Munc13-2 control). (E) The short-term facilitation is significantly less pronounced in the Elfn1 knock-out mouse (p = 0.0065, Kruskal-Wallis ANOVA, post hoc Dunn’s test: p = 0.0034, ctrl vs. Elfn knock-out) while there is no change in the short-term plasticity in the Munc13-2 conditional knock-out mouse compared to any of the controls (Kruskal-Wallis ANOVA, post hoc Dunn’s test, p = 1, ctrl vs. Munc13-2 KO, Munc13-2 KO vs. Munc13-2 control). (F) In vitro recorded and biocytin filled PC (blue) expressing Cre-recombinase (green) that is localized to the PC nucleus. Single confocal image. (G) A biocytin filled IN with truncated axon (left) expresses mGluR1α (right red). Maximum intensity projection of four confocal images separated by 1 μm. Box plots represent median and 25/75 percentiles, square represent the mean value, whiskers represent SD. str. ori., stratum oriens, str. pyr., stratum pyramidale, str. rad., stratum radiatum, str. lac.-mol., stratum lacunosum-moleculare.

