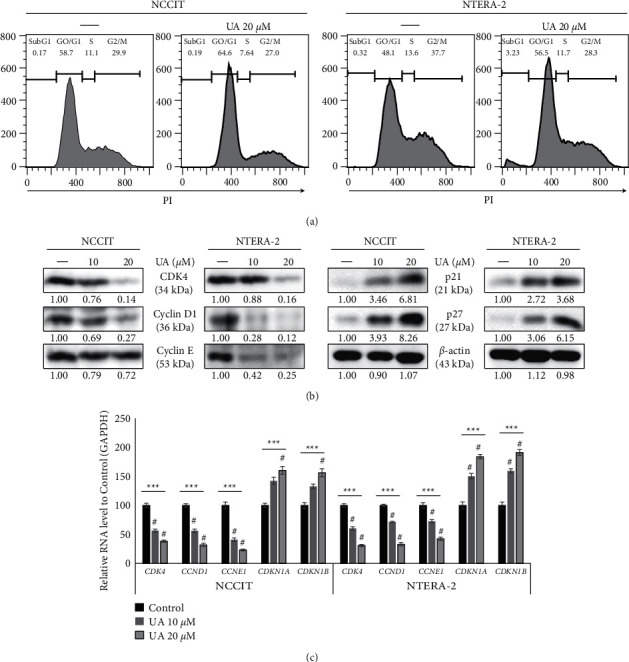
Figure 4.

UA induces G0/G1 cell cycle arrest. (a) Flow cytometry using PI showing cell cycle distribution in NTERA-2 and NCCIT cells after 24 h treatment with 20 μM UA. (b) Immunoblotting analysis of NTERA-2 and NCCIT cells after 24 h treatment with 10 or 20 μM UA showing expression of cyclin D1, cyclin E CDK4, p21, and p27 proteins. Exposure rates were measured by densitometry and are standardized in β-actin levels. Data were obtained in triplicate. (c) RT-qPCR showing genetic expression of a cell cycle test. References representing CDK4, CDKN1B, CCNE1, CDKN1A, and CCND1 mRNA were displayed; Cp values were normalized to GAPDH mRNA. Controls were set to 100. ∗∗∗p < 0.001 (ANOVA test). #p < 0.001 versus control.
