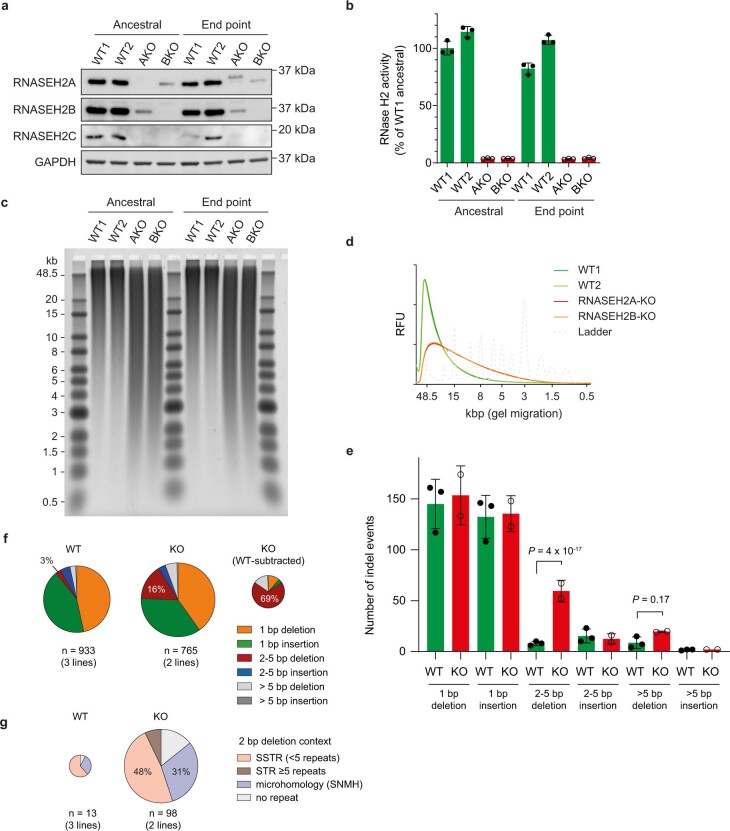
Extended Data Fig. 4. RPE1 RNase H2 null cells accumulate embedded ribonucleotides and 2-5 bp deletions across the genome.
a, b, RNASEH2A and RNASEH2B KO cells (AKO, BKO, respectively) have substantially reduced cellular levels of RNase H2 subunits (a) and are deficient for RNase H2 enzyme activity (b) at the outset (ancestral) and at the end of the mutation accumulation experiment (end point). Individual data points, n = 3 technical replicates; mean ± s.d. For gel source data, see Supplementary Fig. 1. c, d, Alkaline gel electrophoresis of RNase H2 treated genomic DNA (c) shows a substantial increase in fragmentation for RNASEH2A and RNASEH2B KO clones (representative of 3 independent experiments), indicating the presence of more genome-embedded ribonucleotides compared to two WT control clones (d). Densitometry plots of c. RFU, relative fluorescence units. As RNase H2 deficiency activates the p53 pathway14,92, experiments were performed in a TP53 knockout background. e, Only 2–5 bp deletions are significantly increased in RNase H2 null cells. Data points for acquired indel mutations in individual cell lines after 100 population doublings. Individual data points, indel counts per cell line; mean ± s.d.; P-values for two-sided Fisher’s exact test between WT (pooled counts from n = 3 independent clones) and KO (n = 2 independent clones) for one indel type vs all other indel types, after Bonferroni correction. f, Proportions of acquired indels in WT and KO RPE cells. After correction for indels occurring in WT, 69% of indels in RNase H2 null cells are 2–5 bp deletions. n, total indel counts. g, Quantification of 2 bp deletions by context. n, total number of 2 bp deletions. For f, g, chart areas scaled to mutation counts per line.

