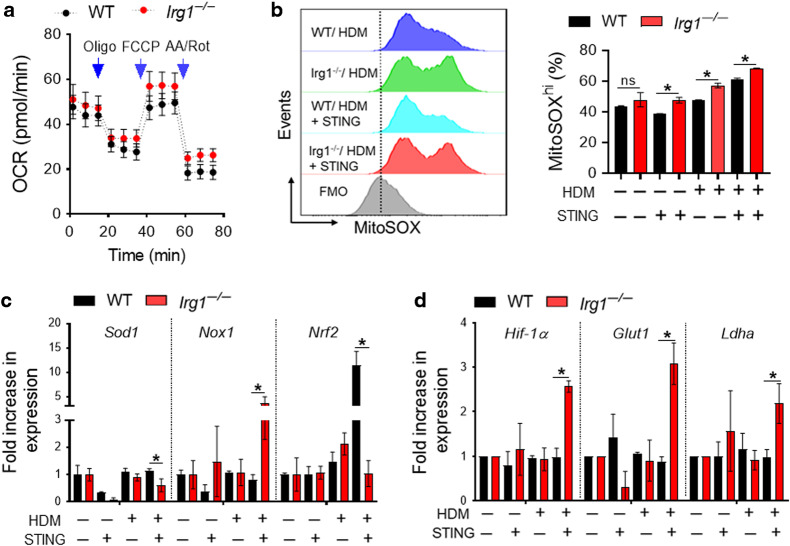
Fig. 4. Increase mitochondrial oxidative stress in Irg1-deficient DC.
a Extracellular flux was analyzed on HDM-pulsed BMDC isolated from WT (black) and Irg1−/− (red) mice. A metabolic stress test was performed, and kinetic oxygen consumption rate (OCR) was graphed in response to sequential treatments of oligomycin (Oligo, 1 mM), carbonyl cyanide 4-(trifluoromethoxy) phenylhydrazone (FCCP, 2 mM), and antimycin A/rotenone (0.5 mM) after basal measurements. Each circle represents the mean ± SE (n = 6). b Histogram overlays (left) and bar graph frequencies of MitoSOXhi CD11c+ CD11b+ BMDC (right) pulsed with HDM or HDM + STING. qPCR for mRNA expression of (c) antioxidant and (d) metabolic genes. (n = 4–6 per group, *P < 0.05, WT versus Irg1−/−, unpaired t-test). Data represent the mean ± SD of at least two independent experiments.

