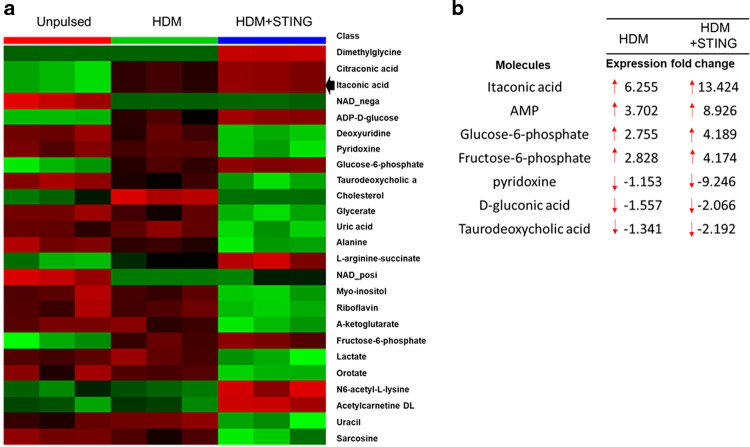
Fig. 6. Induction of itaconate production in HDM-pulsed BMDC.
a Heatmap of selected top 25 metabolites ranked by t-test (P < 0.05) and b IPA of the unbiased metabolomic analysis of extracted polar metabolites from HDM(100 µg ml−1)-pulsed BMDC treated with or without STING agonist c-di-GMP (10 µM) for 16 h. Quantitation of polar metabolites was performed using positive/negative ion-switching LC-MS/MS with a 5500 QTRAP hybrid triple quadrupole mass spectrometer. Each group contained at least 3 replicate samples. The data set was analyzed using IPA software to obtain a list of the top-selected upregulated and downregulated metabolites in HDM-pulsed BMDC treated with and without STING compared with the unpulsed control.

