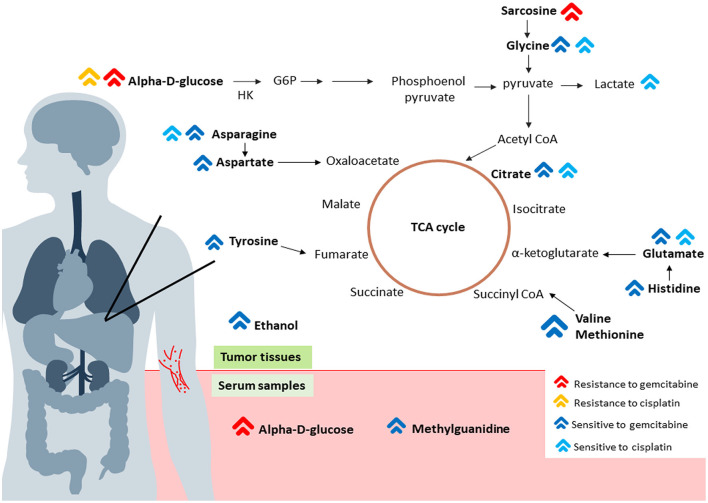
Figure 7.
The possible schematic diagram of the metabolic pathways in both tumor tissues and serum samples of patients with CCA. The red arrows represent metabolite high in a group of patients who are resistant or non-responsive to gemcitabine. The yellow arrow represents metabolite high in a group of patients who are non-responsive to cisplatin. On the other hand, the dark blue arrows represent metabolite high in a group of patients who are responsive to gemcitabine. The blue arrows represent metabolite high in a group of patients who responded to cisplatin. The schematic indicated that, tumor tissues, the low activity of TCA cycles with high glucose in a group of patients who are non-responsive to both gemcitabine and cisplatin consistent with CSC signature. Moreover, high glucose level found in serum sample of patients who are non-responsive to gemcitabine and high level of methylguanidine was found in group of patients who are responsive to gemcitabine.

