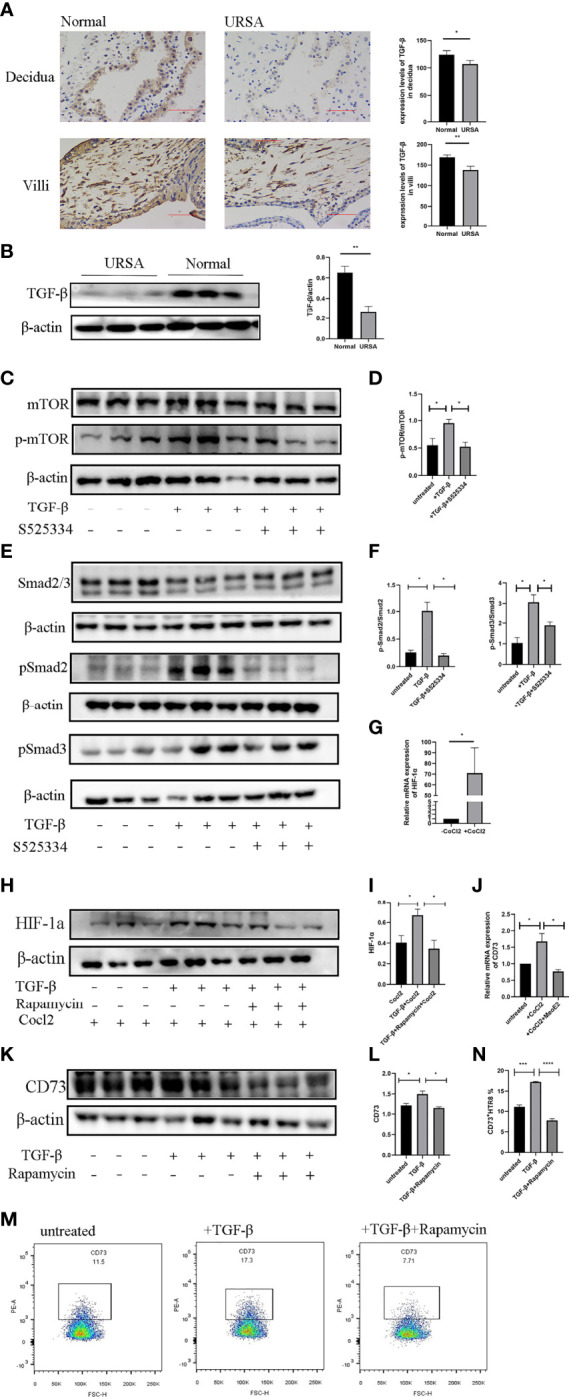
Figure 7.

TGF-b induces the expression of CD73 on HTR-8/SVneo cells via mTOR-HIF-1a. (A) Immunohistochemical staining and villous tissues from normal and URSA pregnancies. Results are shown as mean ± SEM, n = 3 (*P < 0.05, **P < 0.01, two-tailed t tests). (B) Western blot analysis of TGF-β in the villous tissues from normal and URSA pregnancies. Results are shown as mean ± SEM, n = 3 (**P < 0.01, two-tailed t tests). (C, D) Western blot analysis of mTOR and pmTOR in HTR-8/SVneo cells cultured with or without rhTGF-β (10 ng/mL) and the Smad2/3 inhibitor S525334. (E, F) Western blot analysis of Smad2/3 and pSmad2 and pSmad3 in HTR-8/SVneo cells cultured with or without rhTGF-β (10 ng/mL) and the Smad2/3 inhibitor S525334. (G) Relative mRNA levels of HIF-1α in the HTR-8/SVneo cells cultured with or without CoCl2 (100 mM). (H, I) HTR-8/SVneo cells were treated with or without rapamycin (10 nM) for 1 hour, and then stimulated with rhTGF-β (10 ng/mL) (or vehicle) and CoCl2 (100 mM) for 12 hours. The whole cell lysate was analyzed for HIF-1α by Western blot. (J) HTR-8/SVneo cells were cultured with or without CoCl2 (100 mM) and the HIF-1α inhibitor MeoE2 (10 mM) for 24 hours. Relative mRNA levels of CD73 were measured by RT-PCR. (K, L) HTR-8/SVneo cells were treated with the mTOR inhibitor rapamycin (10 nM) for 1 hour and then with rhTGF-β (10 ng/mL) or vehicle for 24 hours. The whole cell lysate was analyzed for CD73 by Western blot. (M, N) The percentages of CD73+ HTR-8/SVneo cells from the abovementioned experiment were further analyzed with flow cytometry. Means of three different experiments ± SEM are shown (*P < 0.05, **P < 0.01, ***P < 0.001, ****P < 0.0001, two-tailed t tests or one-way ANOVA and post hoc tests).
