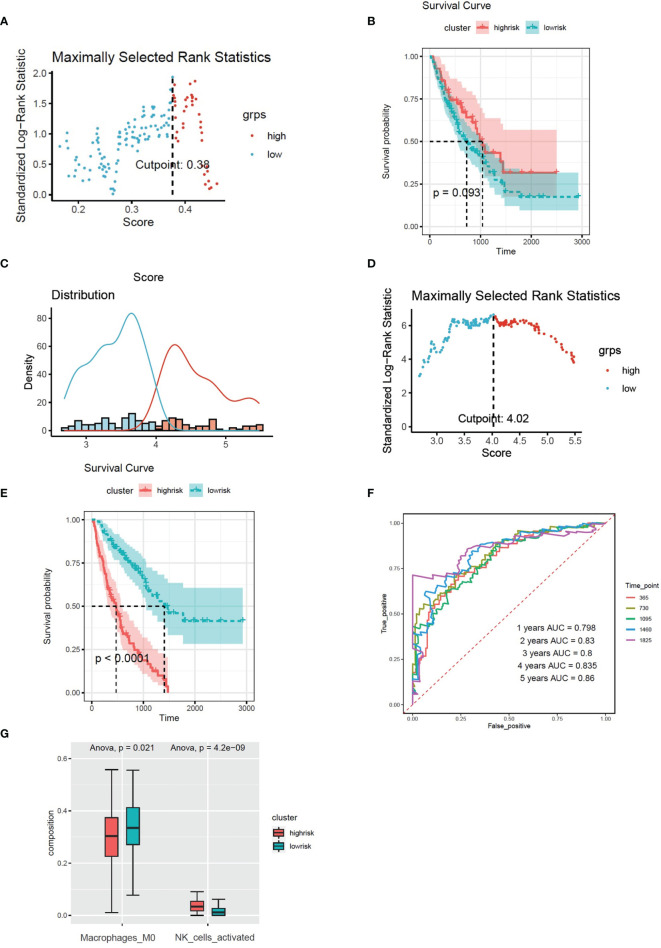
Figure 6.
(A) The cut-off point with the maximum standard log-rank statistic was marked with a vertical dashed line. (B) Kaplan–Meier plot of overall survival in two clusters based on the infiltration of M0 cells. (C) Histogram based on maximally selected rank grouping. (D) The cut-off point with the maximum standard log-rank statistic was marked with a vertical dashed line. (E) Kaplan–Meier plot of overall survival in two clusters based on the combined model (combined risk score). (F) The ROC curve in the combined risk models. (G) The infiltration of activated NK cells and M0 cells in two clusters based on the combined risk models.

