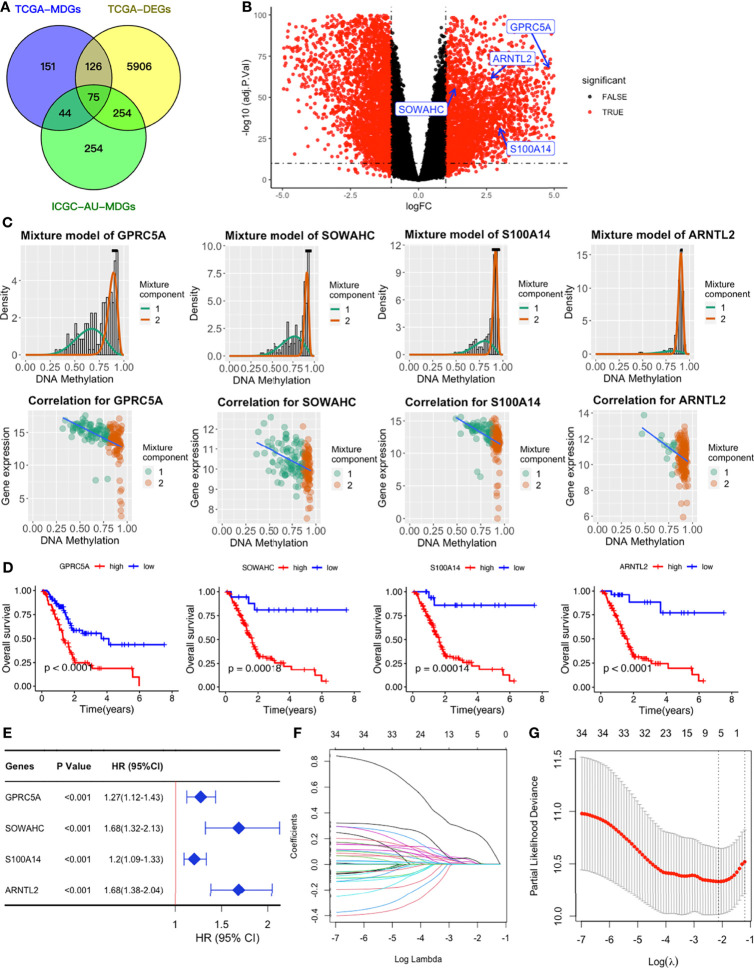
Figure 2.
Establishment of a four-MDG signature. (A) Venn diagram showing DEGs and MDGs from the TCGA and ICGC datasets. (B) Volcano plot of DEGs with the four-MDG signature gene marked. (C) Distribution maps showing the degree of methylation degree (the top row) of the four signature genes and their correlation plots (the bottom row) between mRNA expression and DNAm levels. (D) K-M curves for the four MDGs in the TCGA dataset. (E) Univariate Cox regression of the four signature genes in the TCGA dataset. (F) LASSO coefficient profiles of the 35 genes in the TCGA dataset. (G) Selection of the optimal parameter (lambda) in the LASSO model.

