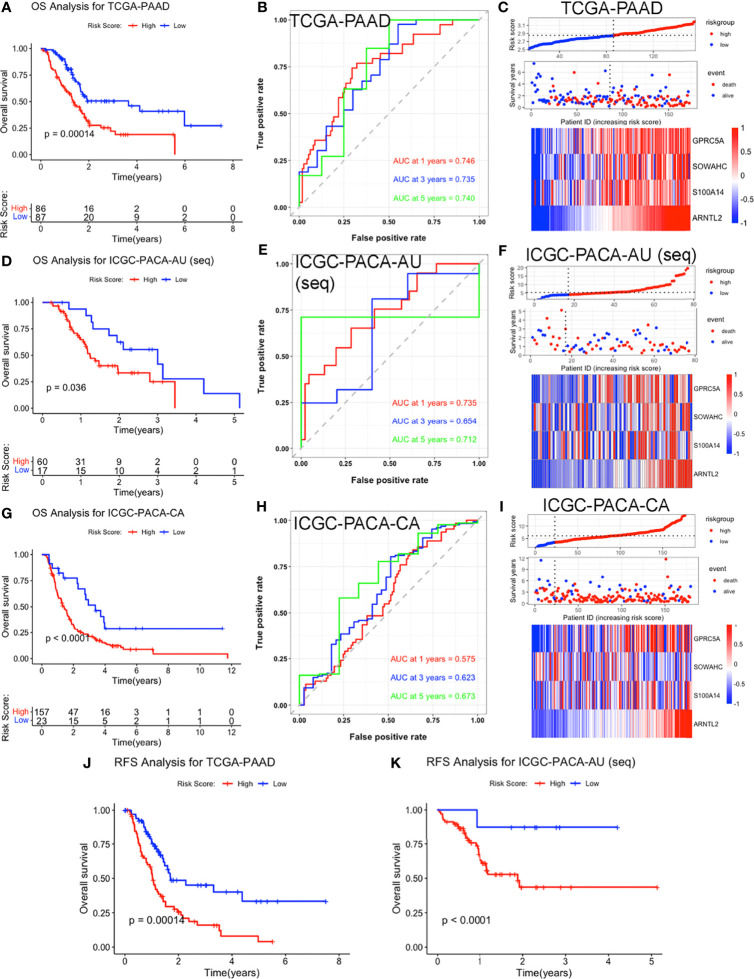
Figure 3.
Validation of the four-MDG signature in the TCGA-PAAD, ICGC-PACA-AU (seq), and ICGC-PACA-CA datasets. (A, D, G) K-M survival curves showing OS of patients in the high and low risk-score subgroups across three datasets. (B, E, H) Time‐dependent ROC curves of the signature. (C, F, I) Risk-score distribution plots for the three datasets. In each plot, from top to bottom: distribution of risk-scores, distribution of survival status, expression patterns of the four genes. (J, K) K-M analysis for RFS of high and low risk-score subgroups in TCGA-PAAD and ICGC-PACA-AU (seq) datasets.

