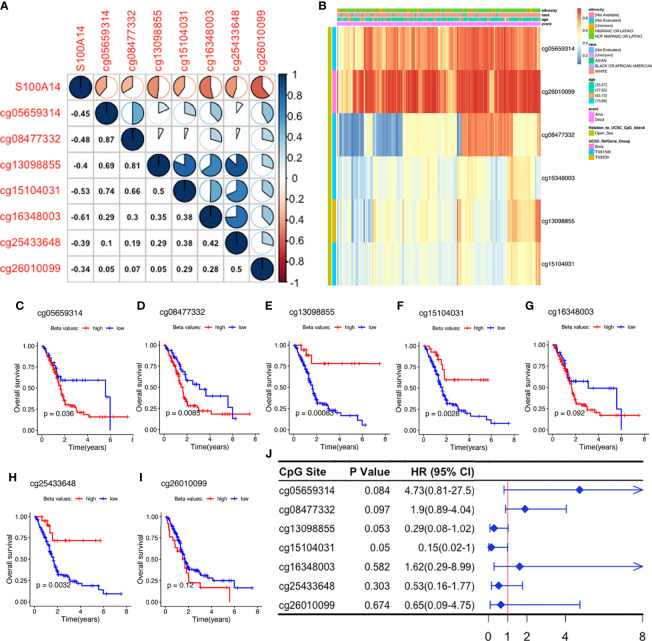
Figure 4.
Exploration of S100A14 cg sites. (A) Pearson’s correlation between DNAm levels of the cg sites and S100A14 mRNA expression levels. (B) DNAm beta value heatmaps of S100A14. (C–I) K-M survival curves showing OS of patients with high and low beta values at each cg site in the TCGA-PAAD dataset. (J) Univariate Cox regression analysis for OS of S100A14 cg sites in the TCGA dataset.

