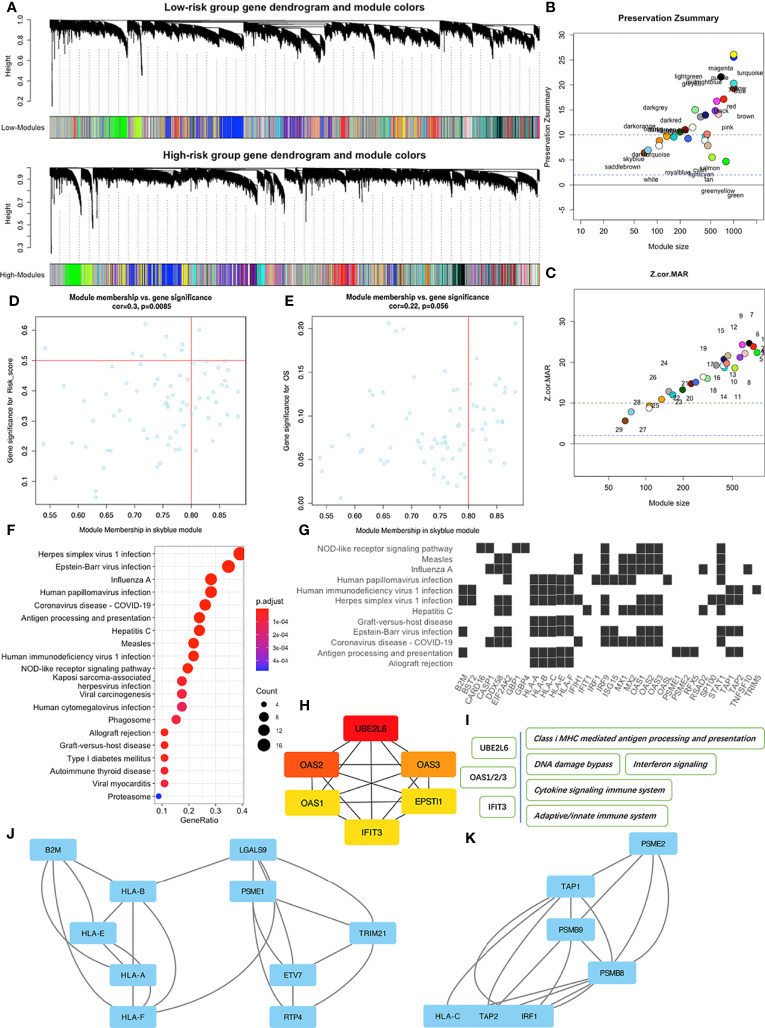
Figure 5.
WGCNA of patients in the high and low risk-score subgroups in the TCGA-PAAD dataset. (A) Dendrograms of high and low risk-score subgroups. (B) The Preservation Zsummary of co-expression modules. (C) The Preservation Z-Statistics of co-expression modules. (D) Scatter plot for the module membership vs. gene significance for risk-scores in the skyblue module. (E) Scatter plot for module membership vs. gene significance for OS in the skyblue module. (F) Functional enrichment analysis of skyblue module genes for KEGG pathways. (G) Distribution of some skyblue module genes involved in specific links in the enriched KEGG pathways. (H) The six hub genes of skyblue module identified by cytoHubba. (I) Some pathways associated with the hub genes. (J, K) Two of the three key sub networks of the skyblue module.

