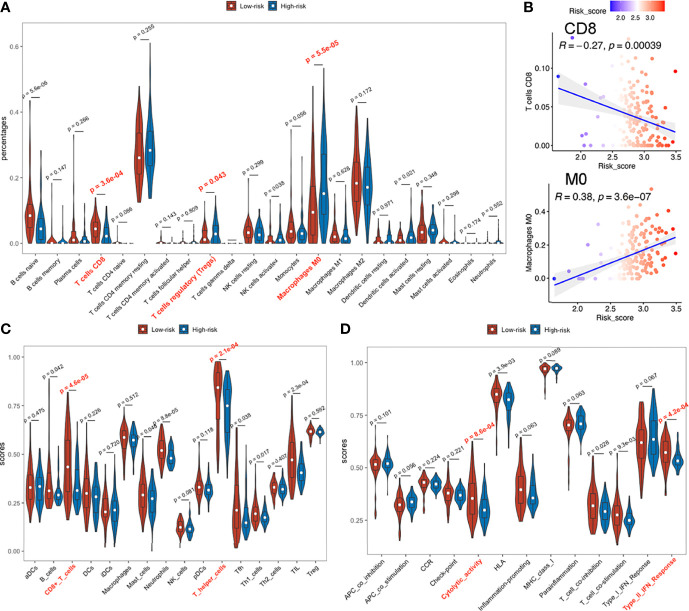
Figure 7.
Immune infiltration status of TCGA-PAAD dataset. (A) Abundances of 22 immune cells by CIBERSORT. (B) Upper: correlation between of CD8+ T cell infiltration with the signature; lower: correlation between M0 macrophage with the signature. (C, D) Immune cell infiltration analysis and immune function enrichment by ssGSEA.

