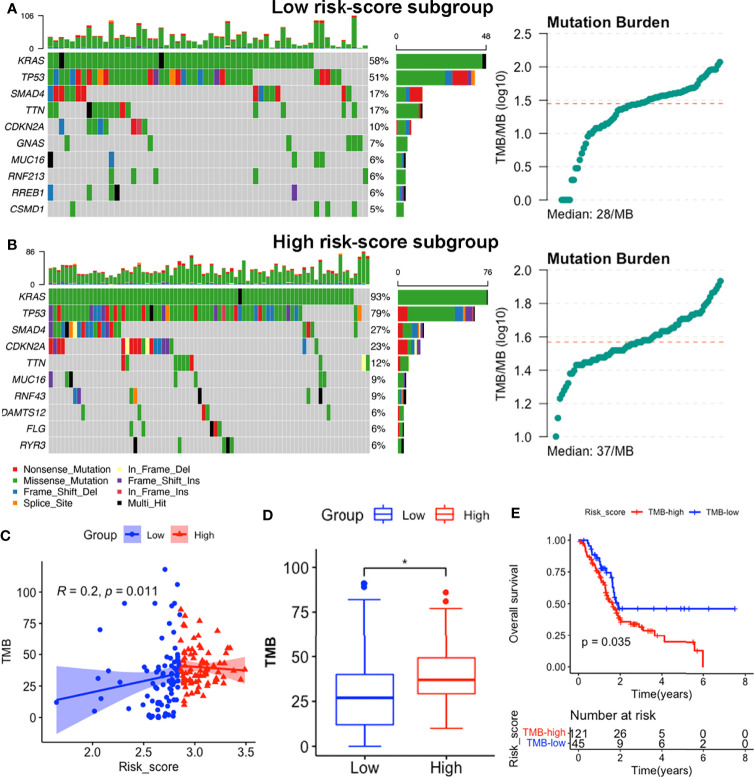
Figure 9.
Somatic mutation features between subgroups in the TCGA-PAAD dataset. (A, B) Somatic mutation landscape and TMB status of low-risk (A) and high-risk (B) subgroups. (C) Correlation between TMB levels with risk-scores. (D) Comparisons of TMB distributions of the two subgroups by t-test. (E) K-M survival curves showing OS of patients with high and low TMB. (*p<0.05).

