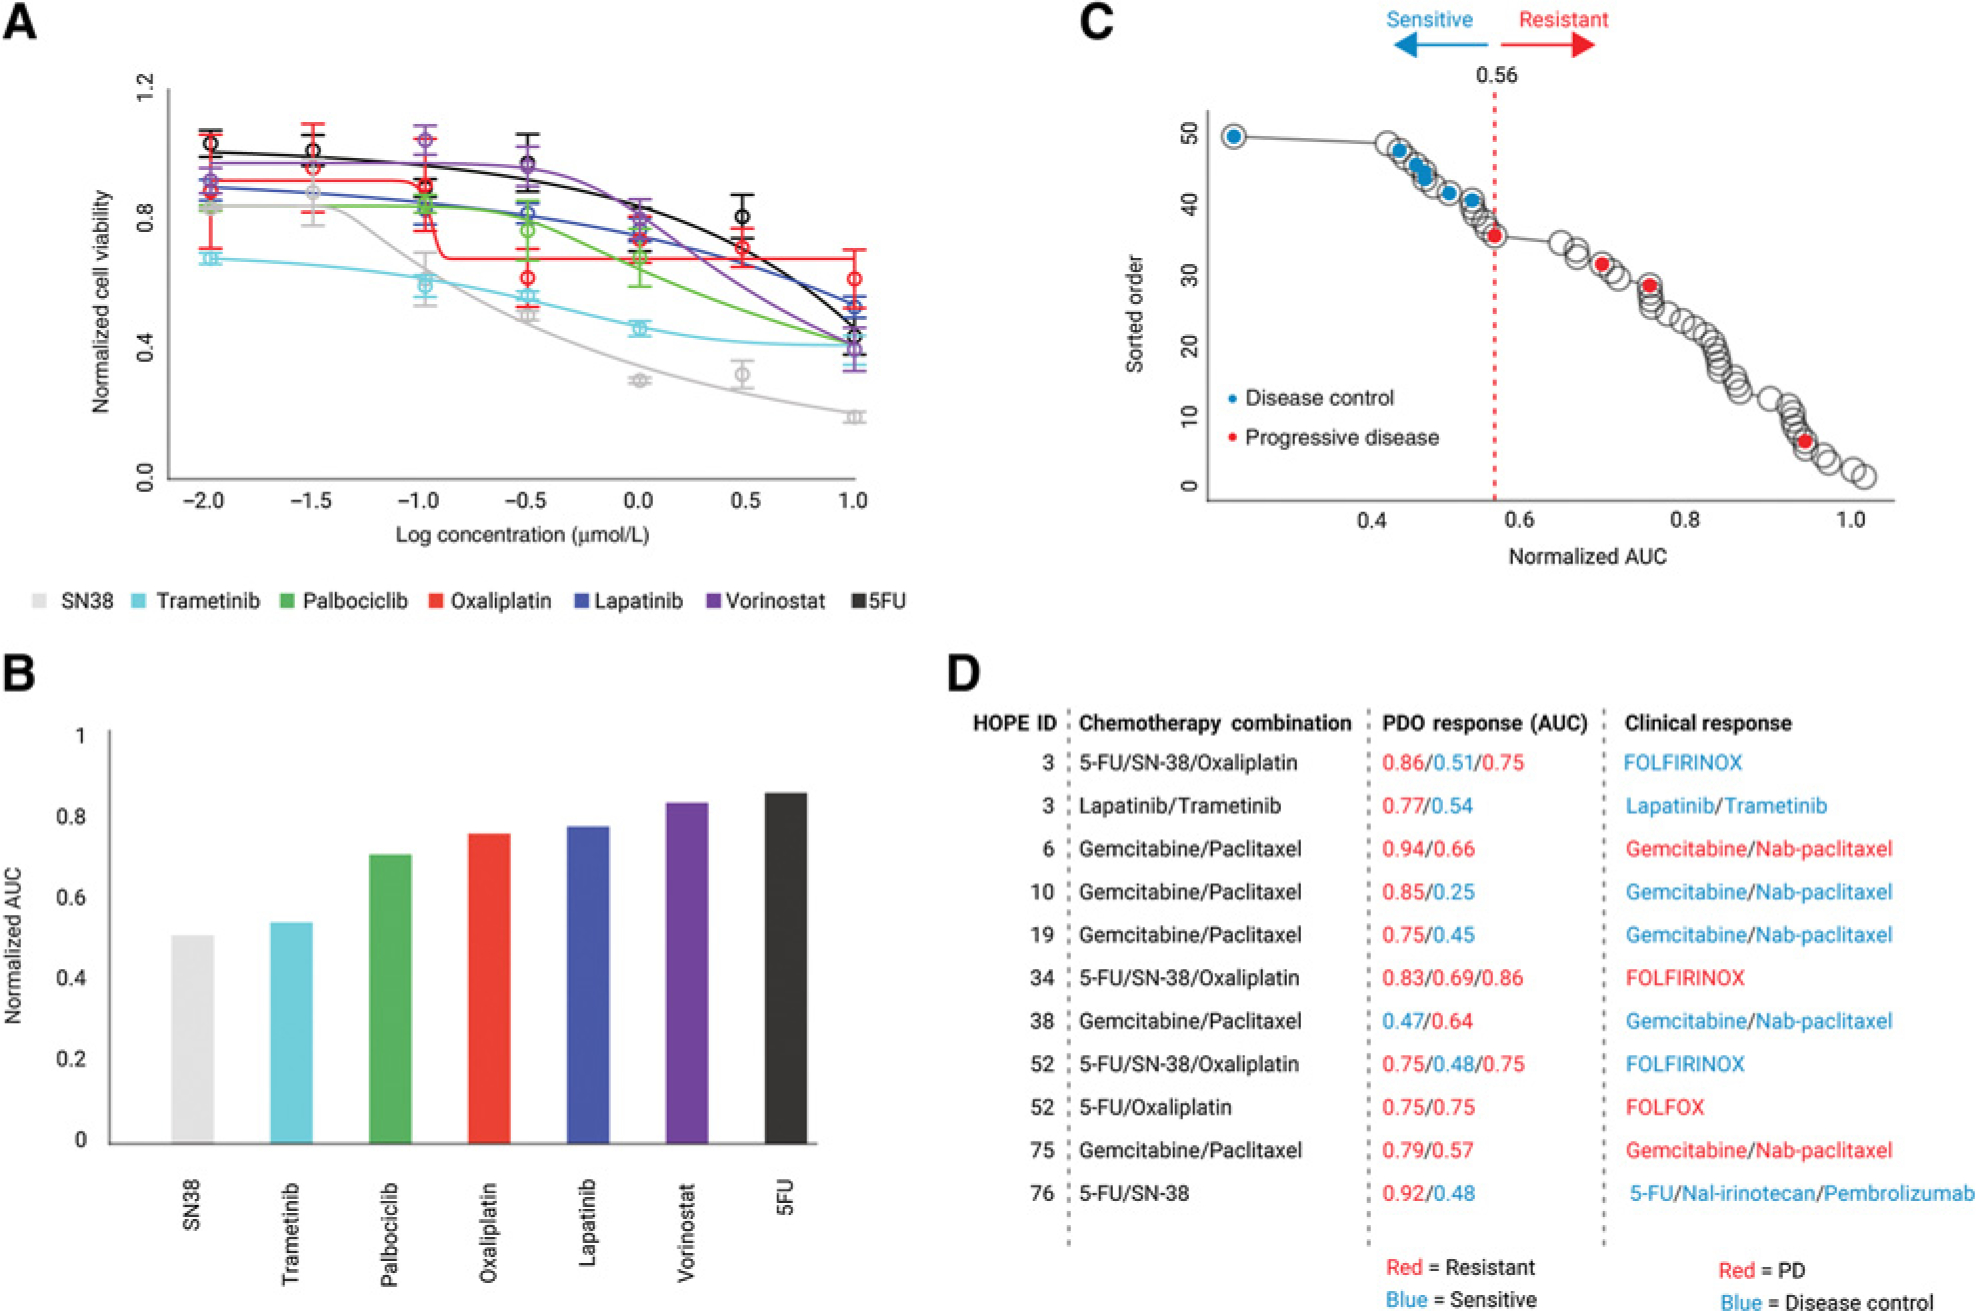
Figure 4.

Correlation of PDO drug dose response to clinical response. A, Drug dose–response curves for drug testing on PDOs from patient 3. Drugs were selected based on treatments the patient received and was likely to receive, with a dose range of three orders of magnitude from 0.01 to 10 μmol/L. B, AUC calculated for drug responses in A. Dose–response curves were fitted using weighted n-parameter logistic regression, and AUC was estimated using Simpson rule. C, Correlation of AUC and disease control. Ranked AUC values are shown as black circles. Classification of AUC values using the Jenks natural breaks algorithm is shown by dotted lines. Clinical classification is superimposed on AUC circles, with blue representing disease control and red representing PD. D, For each patient with known clinical response to treatment: (a) drug combination received, (b) AUC estimated for the component drug responses in PDOs, and (c) clinical response classified as disease control (SD or PR) versus PD.
