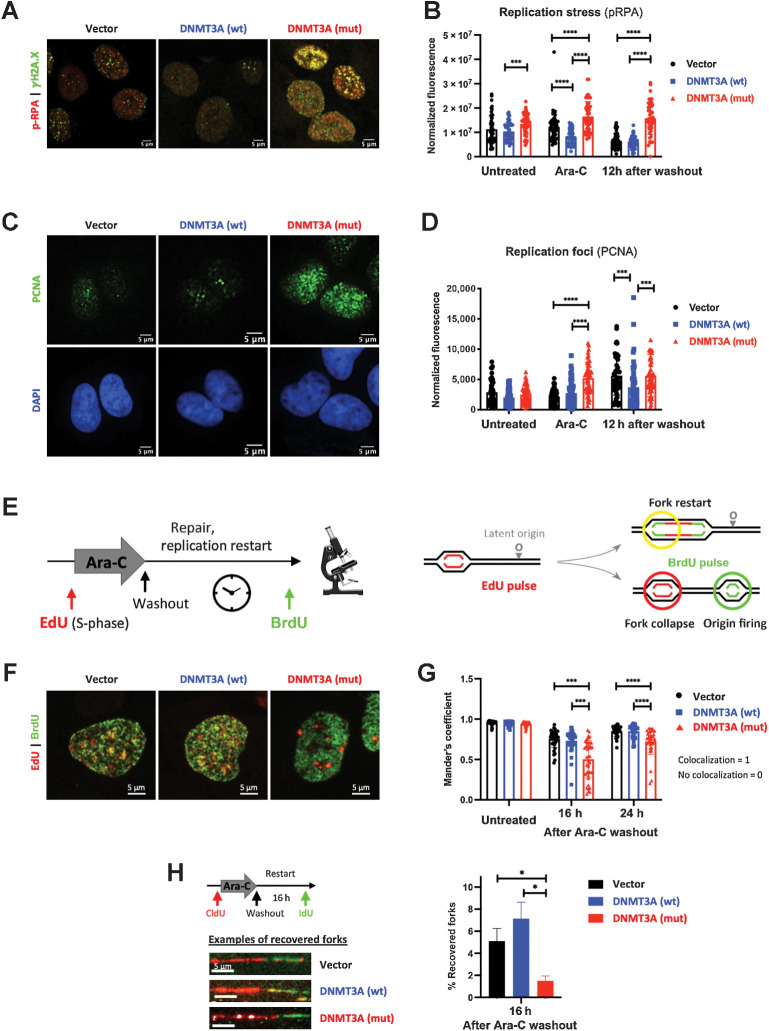
Figure 3.
Cells expressing mutant DNMT3A experience prolonged replication stress after cytarabine treatment. A and B, Replication stress and DNA damage after cytarabine treatment in U2OS cells transduced to express wild-type and mutant DNMT3A or empty vector control. Representative immunofluorescence microscopy images after 12-hour exposure (A, pRPA pSer33, red, and DSB marker γH2A.X, green) and pRPA signal quantification at steady state, 12 hours of treatment, and 12 hours after drug washout in at least 50 cells per condition (B). C and D, Analysis of replication foci by PCNA immunofluorescence staining (green) and DAPI (blue) after 12 hours of cytarabine treatment (C) and PCNA signal quantification in untreated, treated, and 12 hours after drug removal in at least 50 cells per condition (D) in U2OS cells with wild-type and mutant DNMT3A. E–G, Replication restart analysis by EdU and BrdU double-labeling pulse-chase experiments. U2OS cells overexpressing wild-type and mutant DNMT3A or empty vector control were pulsed with EdU (red), treated with cytarabine for 12 hours, and washed and pulsed with BrdU (green) at indicated timepoints (E). Representative immunofluorescence microscopy images of double-labeled cells (F, 16 hours after drug removal) and quantification of BrdU and EdU signal colocalization (Manders coefficient) in at least 25 nuclei per condition at indicated time points after drug removal (G). (***, P < 0.001; ****, P < 0.0001, Mann–Whitney rank-sum test). Each experiment was independently replicated at least three times. H, Recovery of stalled replication forks was measured by DNA fiber assay in U2OS cells expressing wild-type or mutant DNMT3A or empty vector control. Cells were pulsed with CldU (red), treated with Ara-C for 12 hours, allowed to recover for 16 hours after drug washout, and pulsed with IdU (green) prior to harvest. Proportion of recovered forks (double-labeled red/green tracks) was calculated in triplicate, in a single experiment; at least 300 fibers were scored per condition in each replicate (*, P < 0.05; Student t test with Welch correction). Representative examples of recovered forks are shown.

