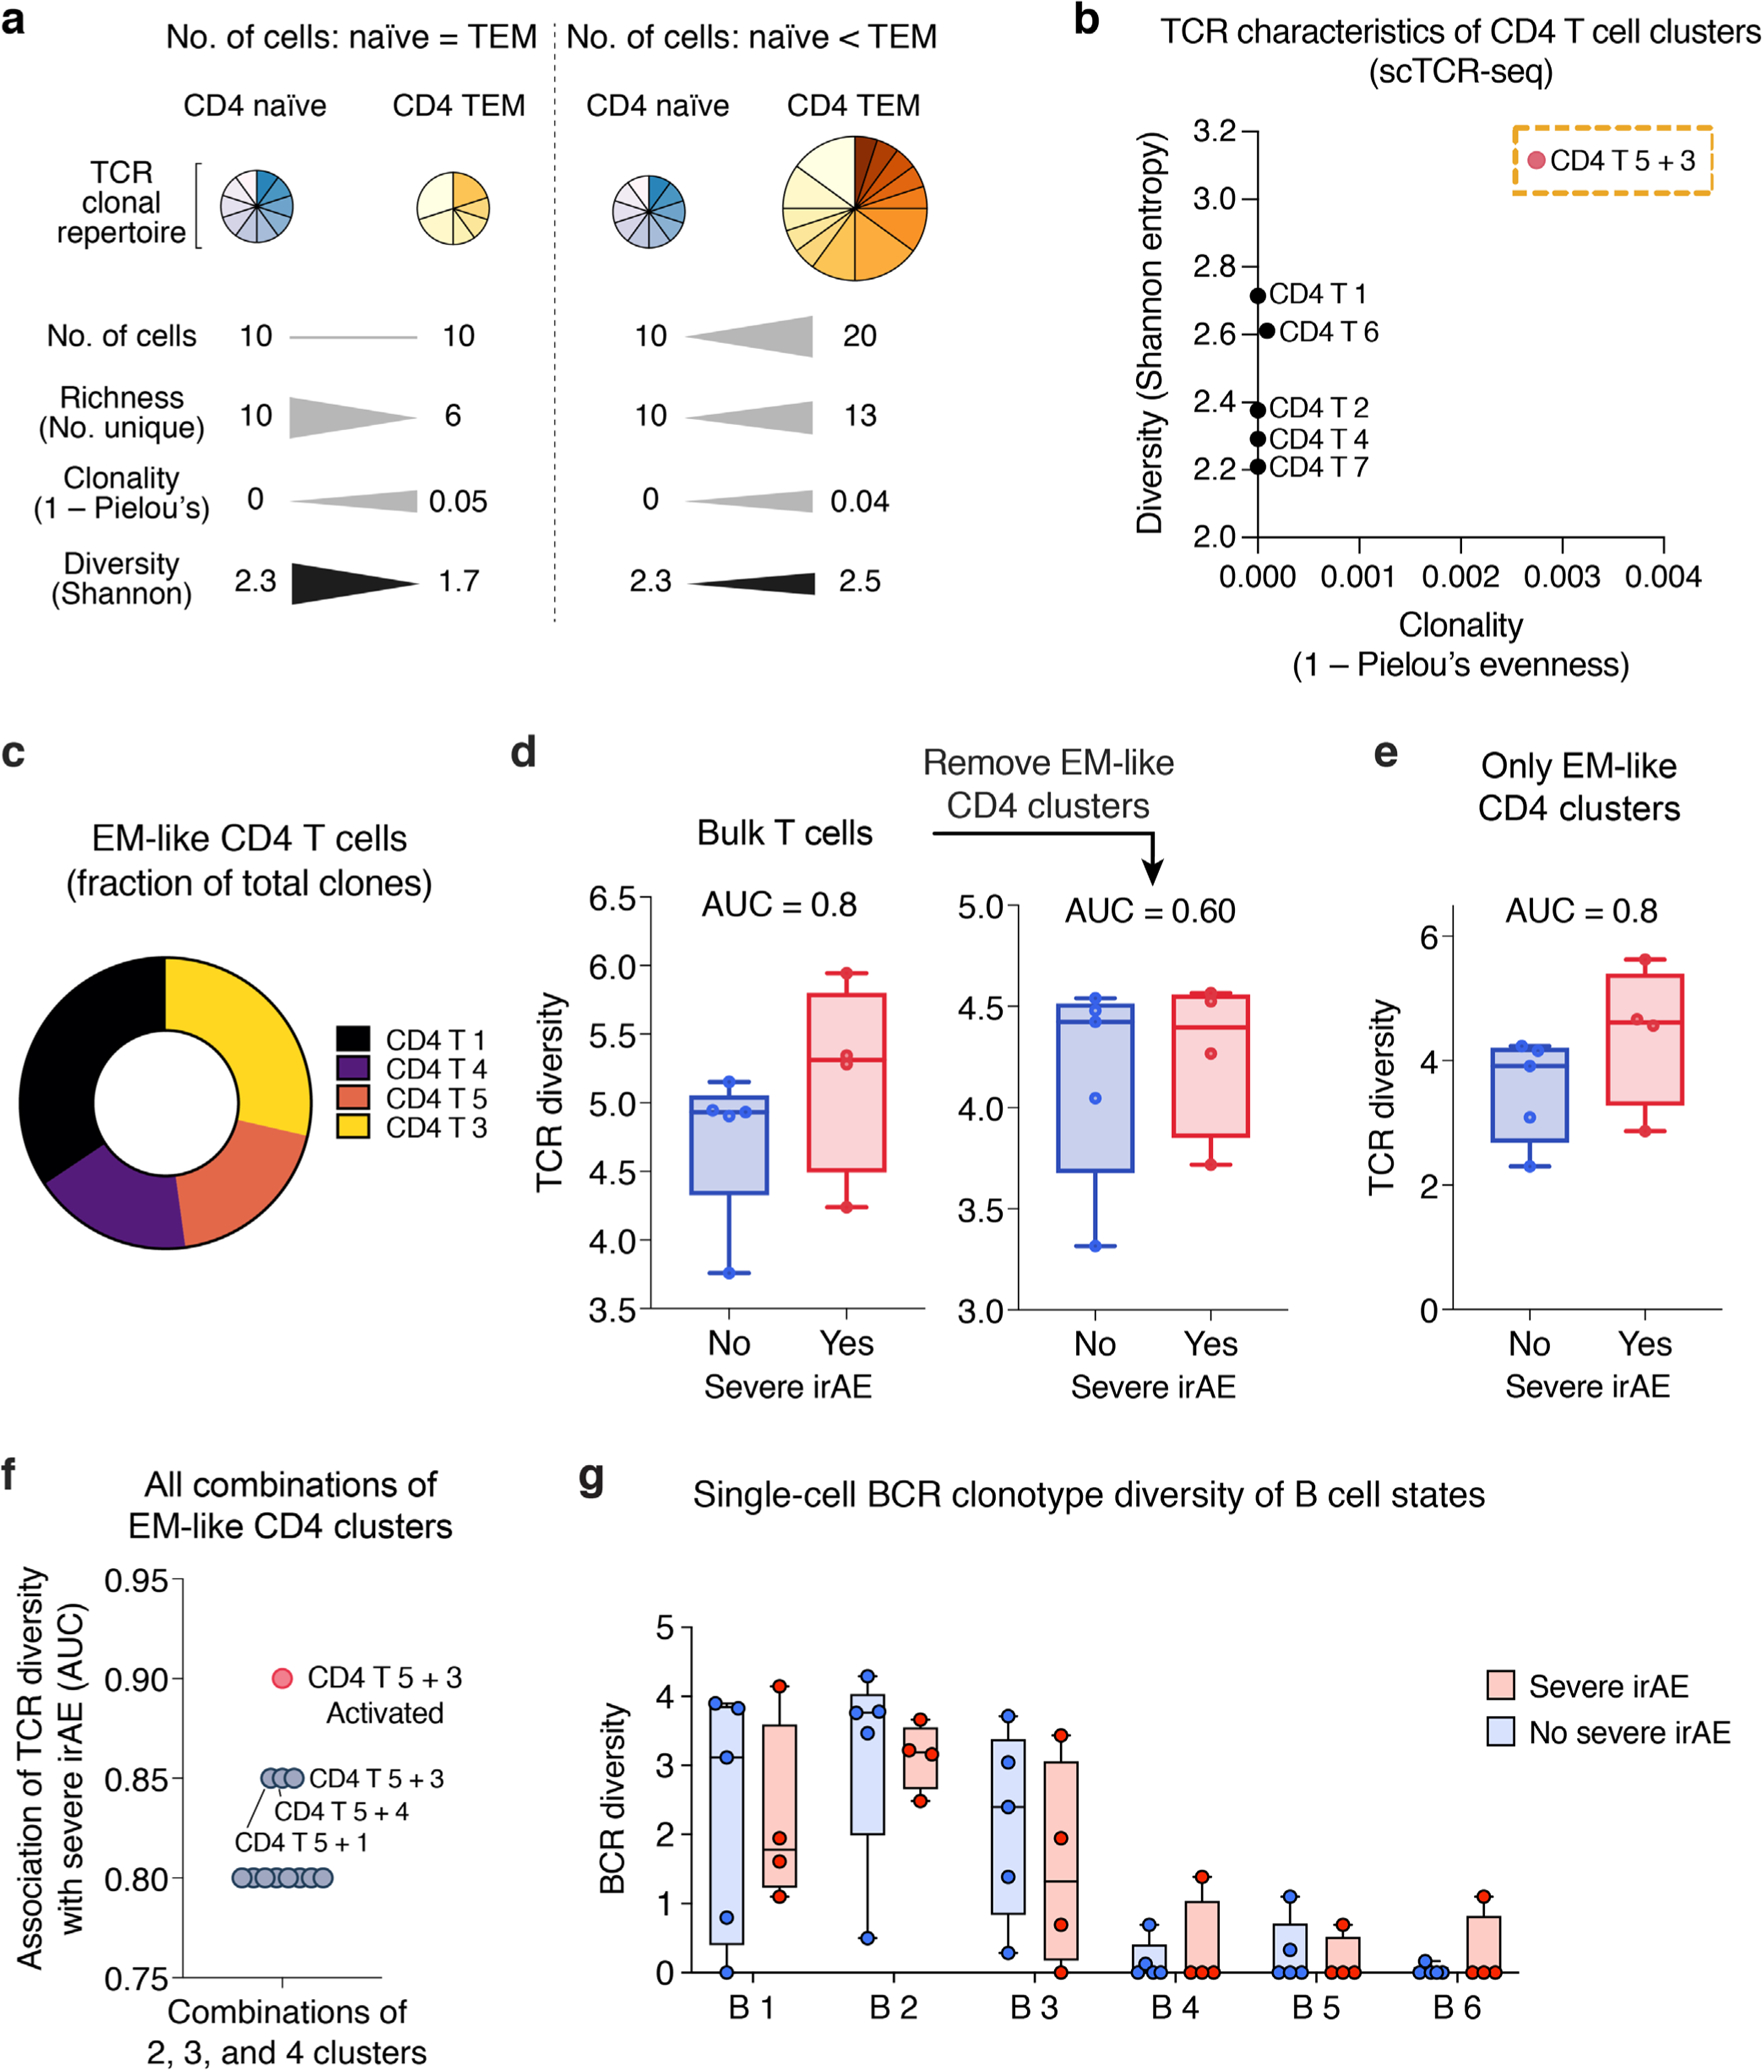
Extended Data Fig. 4 |. Extended characterization of immune repertoire diversity from single-cell V(D)J sequencing data.

a, Key TCR diversity measures and the impact of cell abundance, TCR richness, and distinct clonal repertoires on such measures. Hypothetical CD4 naïve and TEM cell subsets are shown as examples. Triangles depicting differences in magnitude are not drawn to scale. b, Mean Shannon entropy versus mean clonality (1 ‒ Pielou’s evenness) for each CD4 T cell state identified by unsupervised clustering of scRNA-seq data. CD4 T 5 + 3 (Fig. 3b,c), a TEM state enriched for activated cells, shows elevated clonality relative to other CD4 states, as expected for this phenotype77, while also showing higher diversity (Shannon entropy), indicating elevated richness. c, Distribution of EM-like CD4 T cell states (from Fig. 3f) with available scTCR clonotype data. d, Association between severe irAE development and TCR diversity (Shannon entropy) in pseudo-bulk T cells from pretreatment blood, shown for all T cell states identified by scRNA-seq (left) and after the removal of the EM-like states indicated in panel c (no severe irAE, n = 5 patients; severe irAE, n = 4 patients). e, Same as d but shown for EM-like states alone. f, Area under the curve (AUC) for the association between pretreatment peripheral TCR diversity (Shannon entropy) and severe irAE development, shown for all combinations of the constituent cell states in e, including the combined CD4 T 5 + 3 cluster after restricting to activated cells (CPM > 0 for HLA-DX or MKI67). Of note, no other combination of activated EM-like states achieved an AUC > 0.85 in this analysis. g, BCR clonotype diversity (Shannon entropy), shown for each B cell state identified by unsupervised clustering (Fig. 3a). In b, d–f, only patients with at least 100 TCR clones were analyzed (n = 9; Methods). The same patients were analyzed in g for consistency. In panels d, e, and g, center lines, bounds of the box, and whiskers indicate medians, 1st and 3rd quartiles, and minimum and maximum values, respectively.
