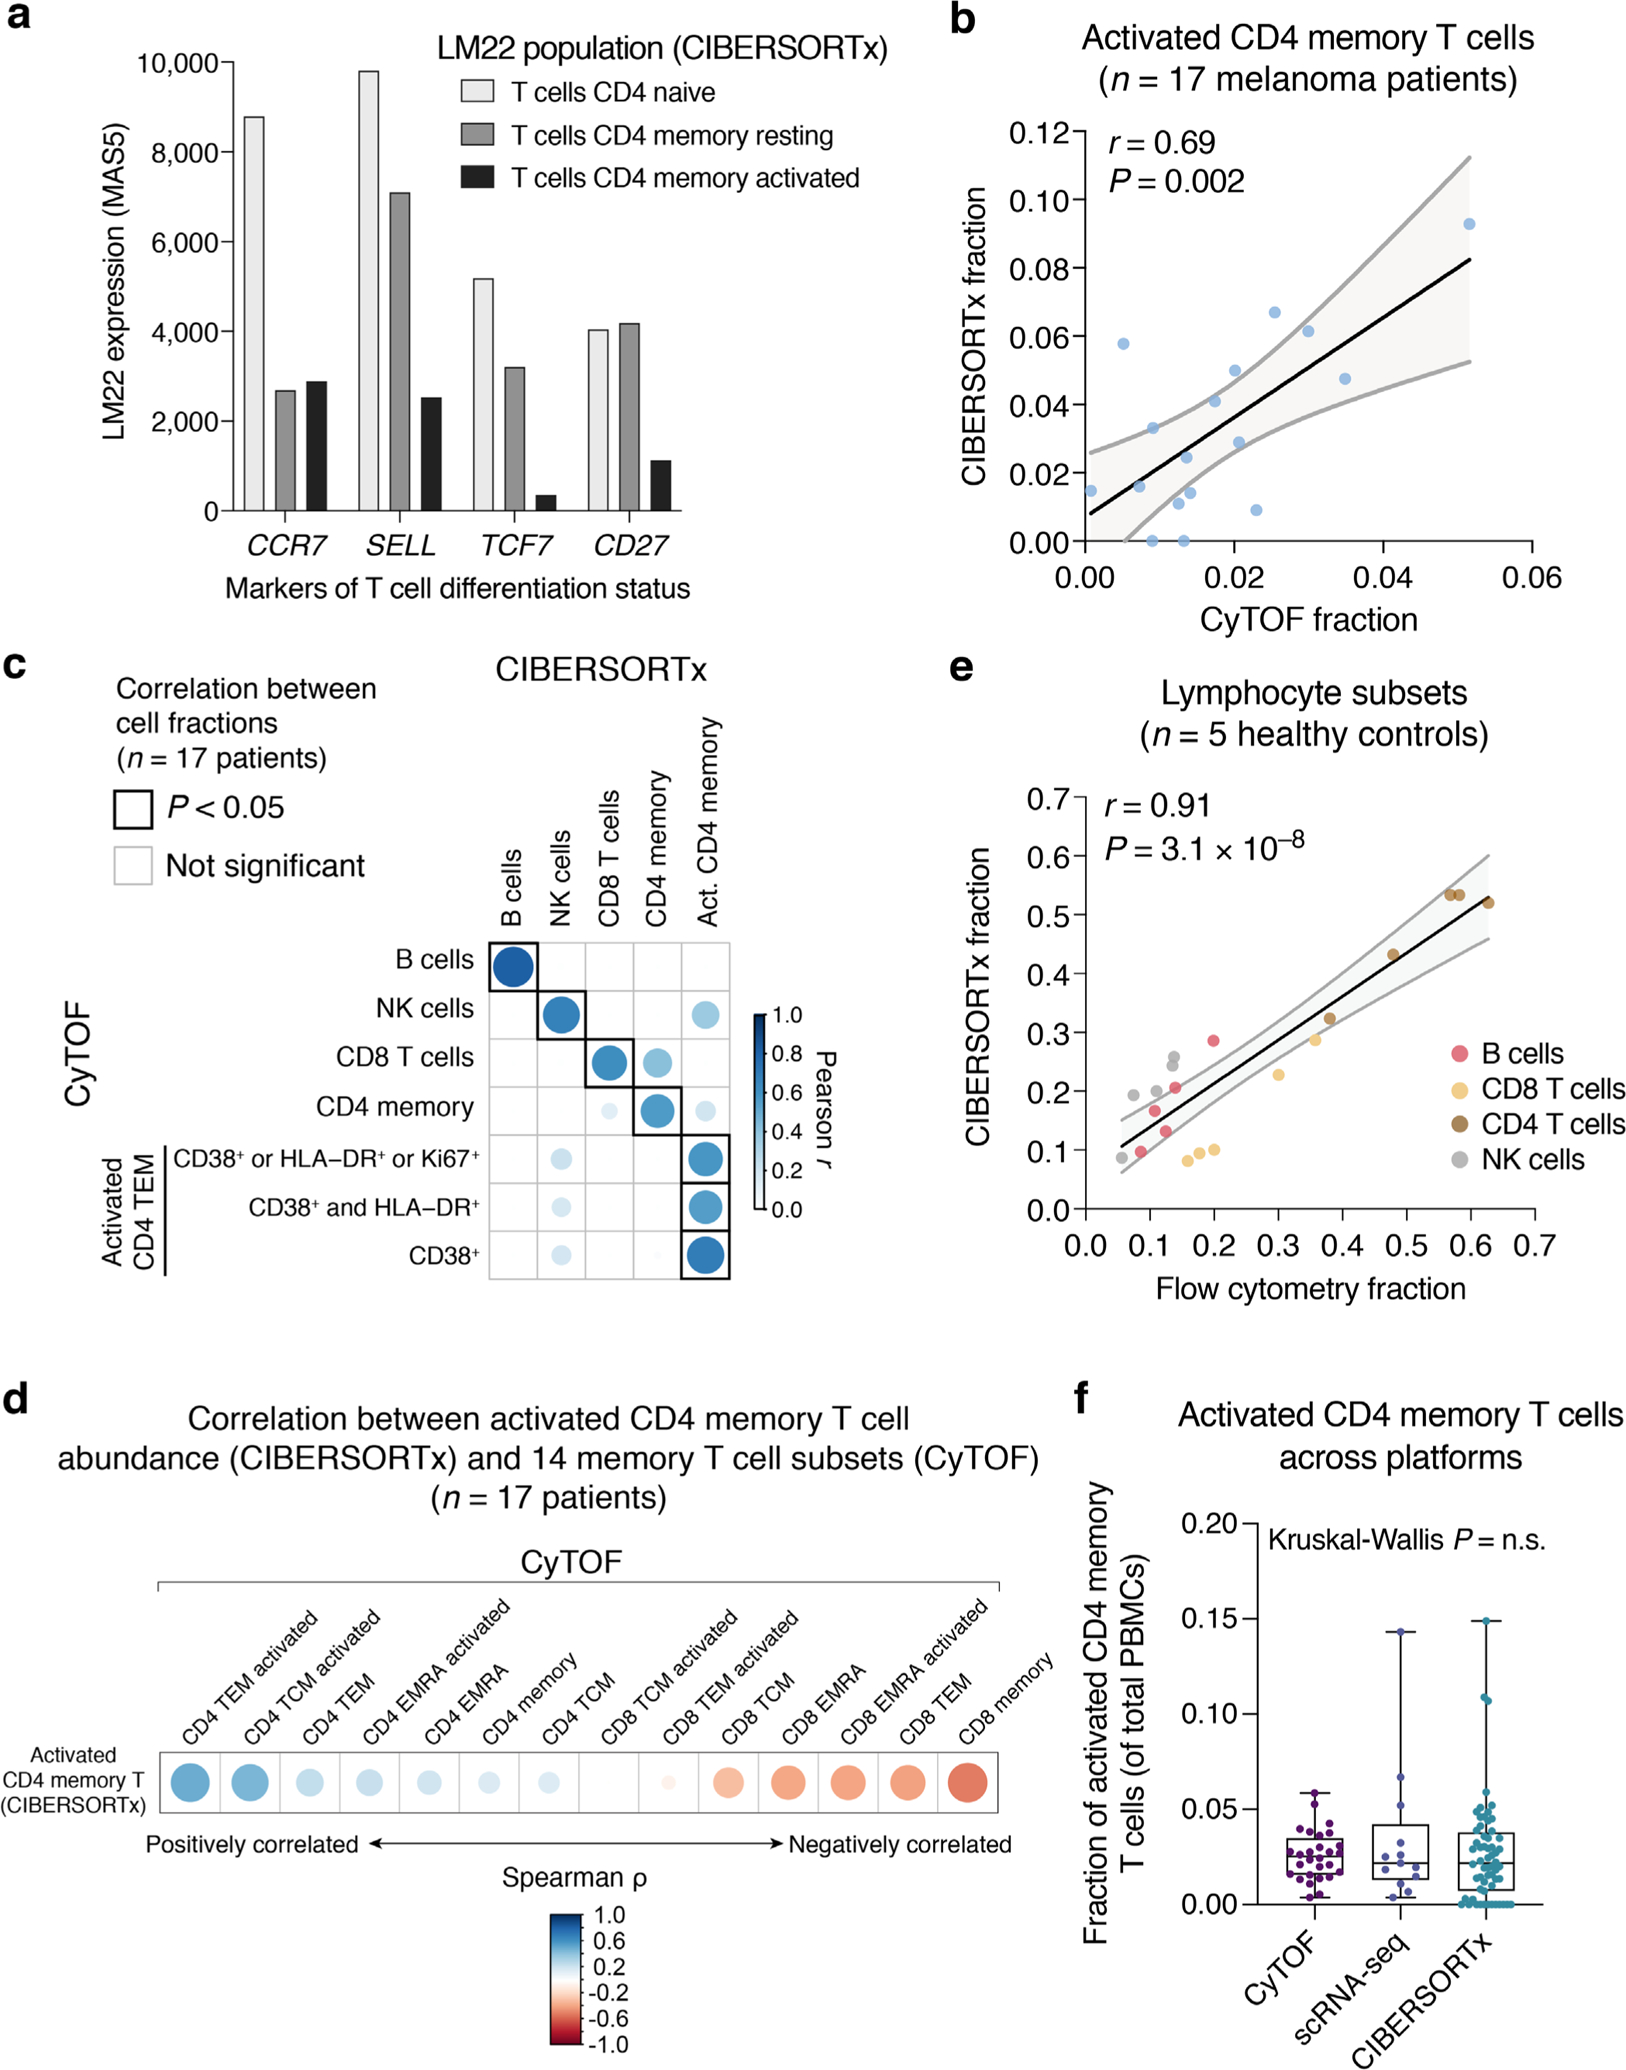
Extended Data Fig. 5 |. Validation of CiBERSORTx by single-cell analysis.

a, Expression of developmentally-regulated marker genes in major CD4 T cell subsets from the LM22 signature matrix (MAS5 normalized), showing that the LM22 reference signature for activated CD4 memory T cells has a TEM profile. b, CIBERSORTx versus mass cytometry for enumeration of activated CD4 memory T cells in the pretreatment peripheral blood of 17 metastatic melanoma patients (Supplementary Table 1). A linear regression line with 95% confidence band is shown. Concordance and significance were determined by Pearson r and a two-sided t test, respectively. While activated CD4 memory T cells quantitated by CyTOF were defined by CD38 expression in this plot, other activated CD4 TEM subsets were also significantly correlated with CIBERSORTx (panel c). c, Cross correlation plot of lymphocyte subset frequencies determined by CyTOF and CIBERSORTx. Act., Activated. d, Correlation between activated CD4 memory T cell levels inferred by CIBERSORTx and 14 memory T cell states profiled by CyTOF, including CD38+ activated subsets manually gated within each population, in PBMCs from 17 metastatic melanoma patients (Supplementary Table 1). e, Scatter plot depicting the global correlation of lymphocyte subsets enumerated by CIBERSORTx and flow cytometry in peripheral blood samples from five healthy subjects profiled by bulk RNA-seq (Supplementary Table 1). A linear regression line with 95% confidence band is shown. Concordance and significance were determined by Pearson r and a two-sided t test, respectively. As monocytes were variably underestimated by cytometry compared to complete blood counts, all results in b–e are expressed as a function of total lymphocytes. f, Distribution of activated CD4 memory T cell levels quantitated by CyTOF (CD38+, HLA-DR+ or Ki67+ CD4 TEM cells, n = 28 patients), scRNA-seq (HLA-DX+ or MKI67+ cells within CD4 T clusters 5 and 3, n = 13 patients), and CIBERSORTx (n = 60 patients) across all irAE-evaluable samples profiled by each modality in this work (Supplementary Table 1). Box center lines, bounds of the box, and whiskers indicate medians, 1st and 3rd quartiles, and minimum and maximum values, respectively. Statistical significance was determined by a Kruskal-Wallis test. n.s., not significant (P > 0.05).
