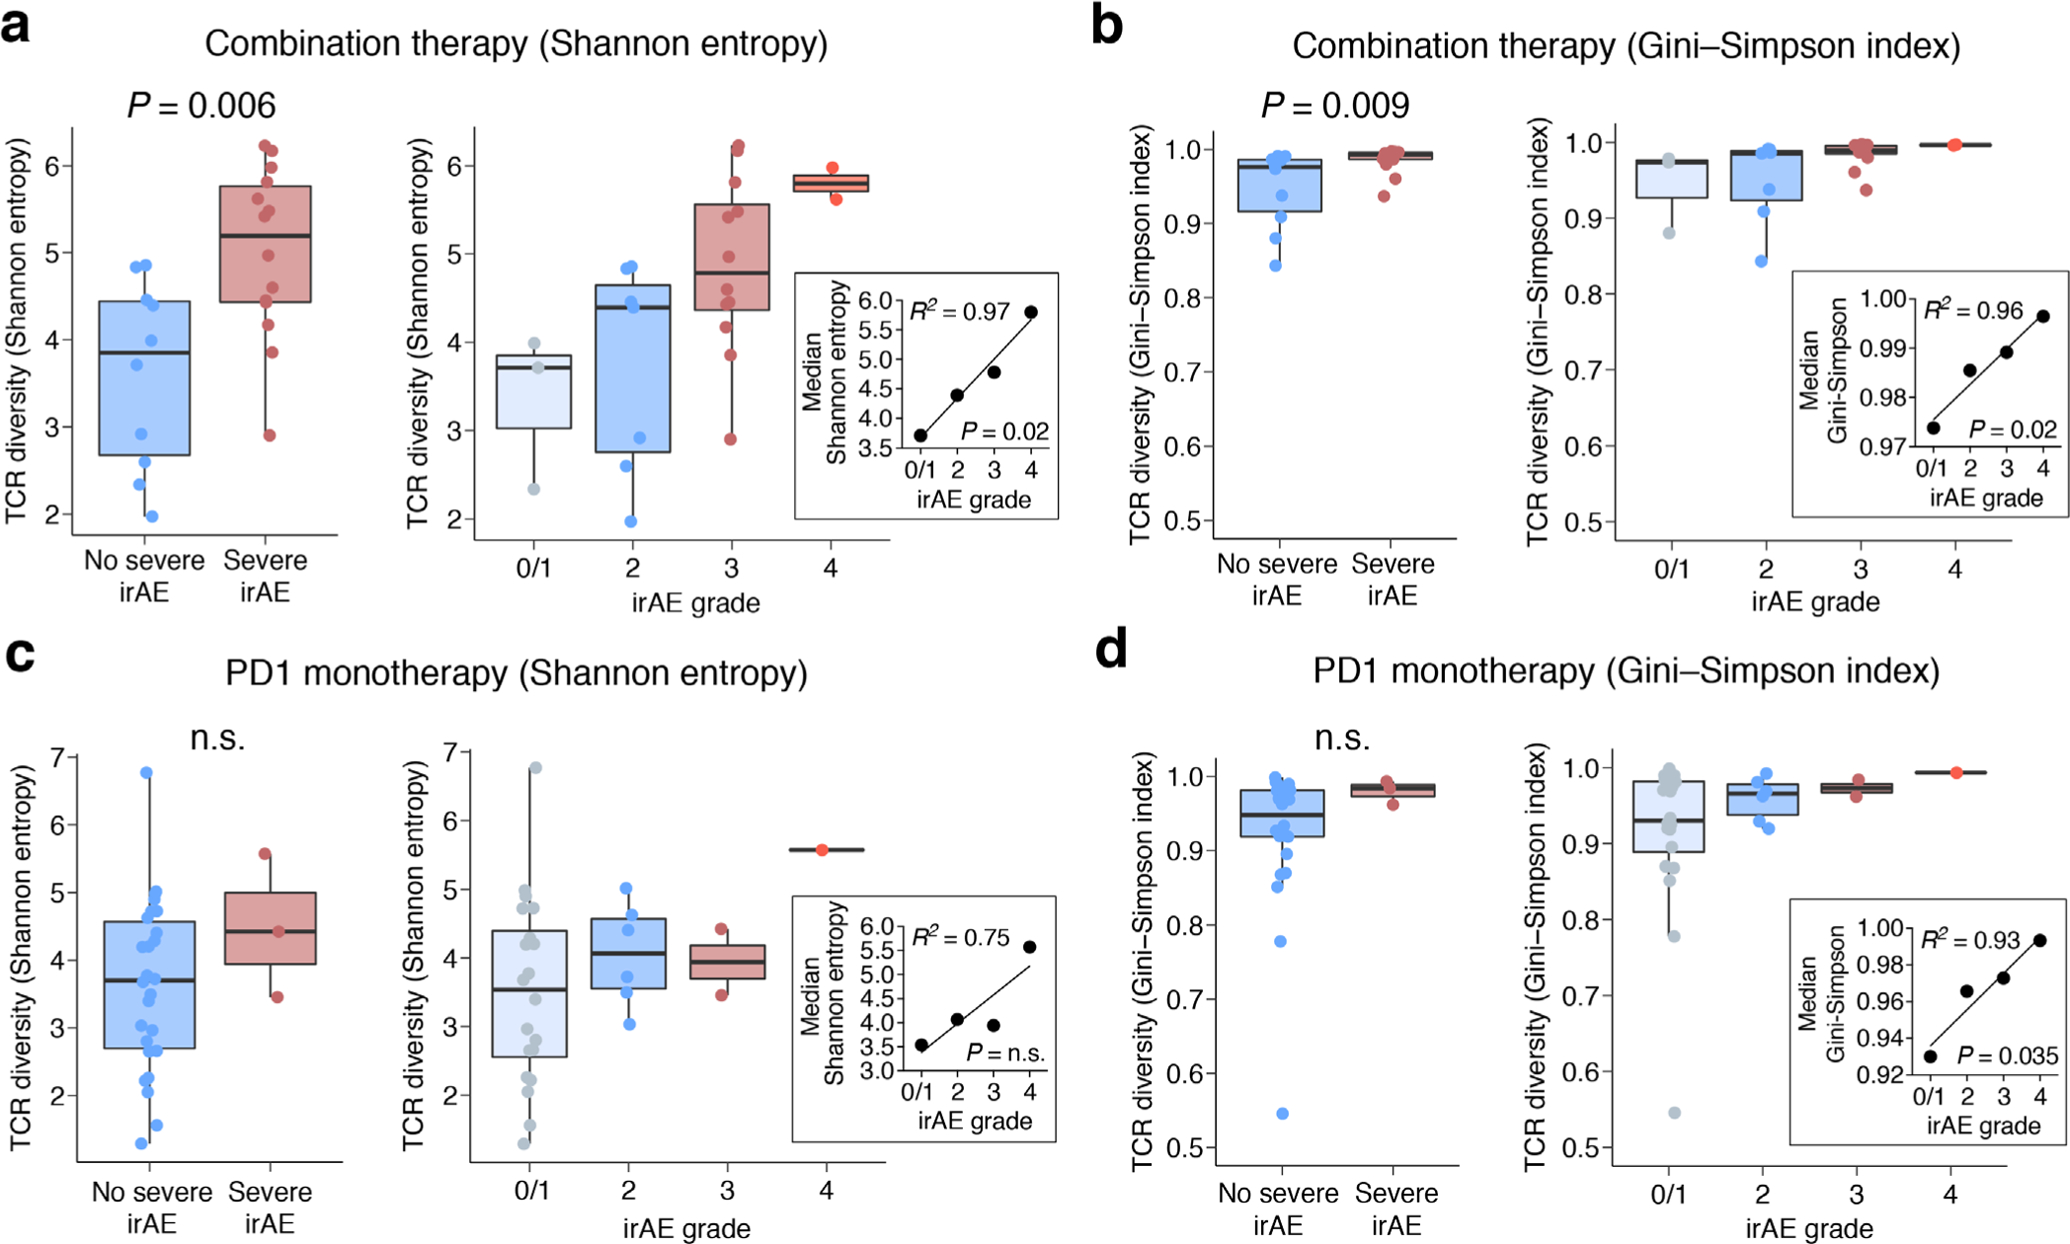
Extended Data Fig. 6 |. Extended analysis of TCR diversity from pretreatment peripheral blood expression profiles.

a–d, Association between baseline bulk TCR diversity and the highest irAE grade observed for each patient in bulk cohorts 1 and 2 (Supplementary Tables 7 and 9), shown for two diversity measures (a and c, Shannon entropy; b and d, Gini-Simpson index) and stratified by therapy type. In a and b, patients treated with combination therapy are stratified by future irAE status: no severe irAE (n = 10) versus severe irAE (n = 14 patients) (left) and irAE grade (right): 0/1 (n = 3), 2 (n = 7), 3 (n = 12), and 4 (n = 2). In c and d, patients treated with PD1 monotherapy are stratified by future irAE status: no severe irAE (n = 26) versus severe irAE (n = 3 patients) (left) and irAE grade (right): 0/1 (n = 19), 2 (n = 7), 3 (n = 2), and 4 (n = 1). Two-group comparisons were assessed by a two-sided, unpaired Wilcoxon rank sum test. n.s., not significant (P > 0.05). Linear regression was applied to evaluate the median value of each measure grouped by irAE grade (insets). The significance of linear concordance was determined by a two-sided t test. Grades 0 and 1 reflect no toxicity and asymptomatic toxicity, respectively, and were combined. In all panels, the box center lines, bounds of the box, and whiskers denote medians, 1st and 3rd quartiles, and minimum and maximum values within 1.5 × IQR (interquartile range) of the box limits, respectively.
