
Extended Data Fig. 8 |. Composite model performance for predicting time to severe irAE in validation bulk cohort 2.
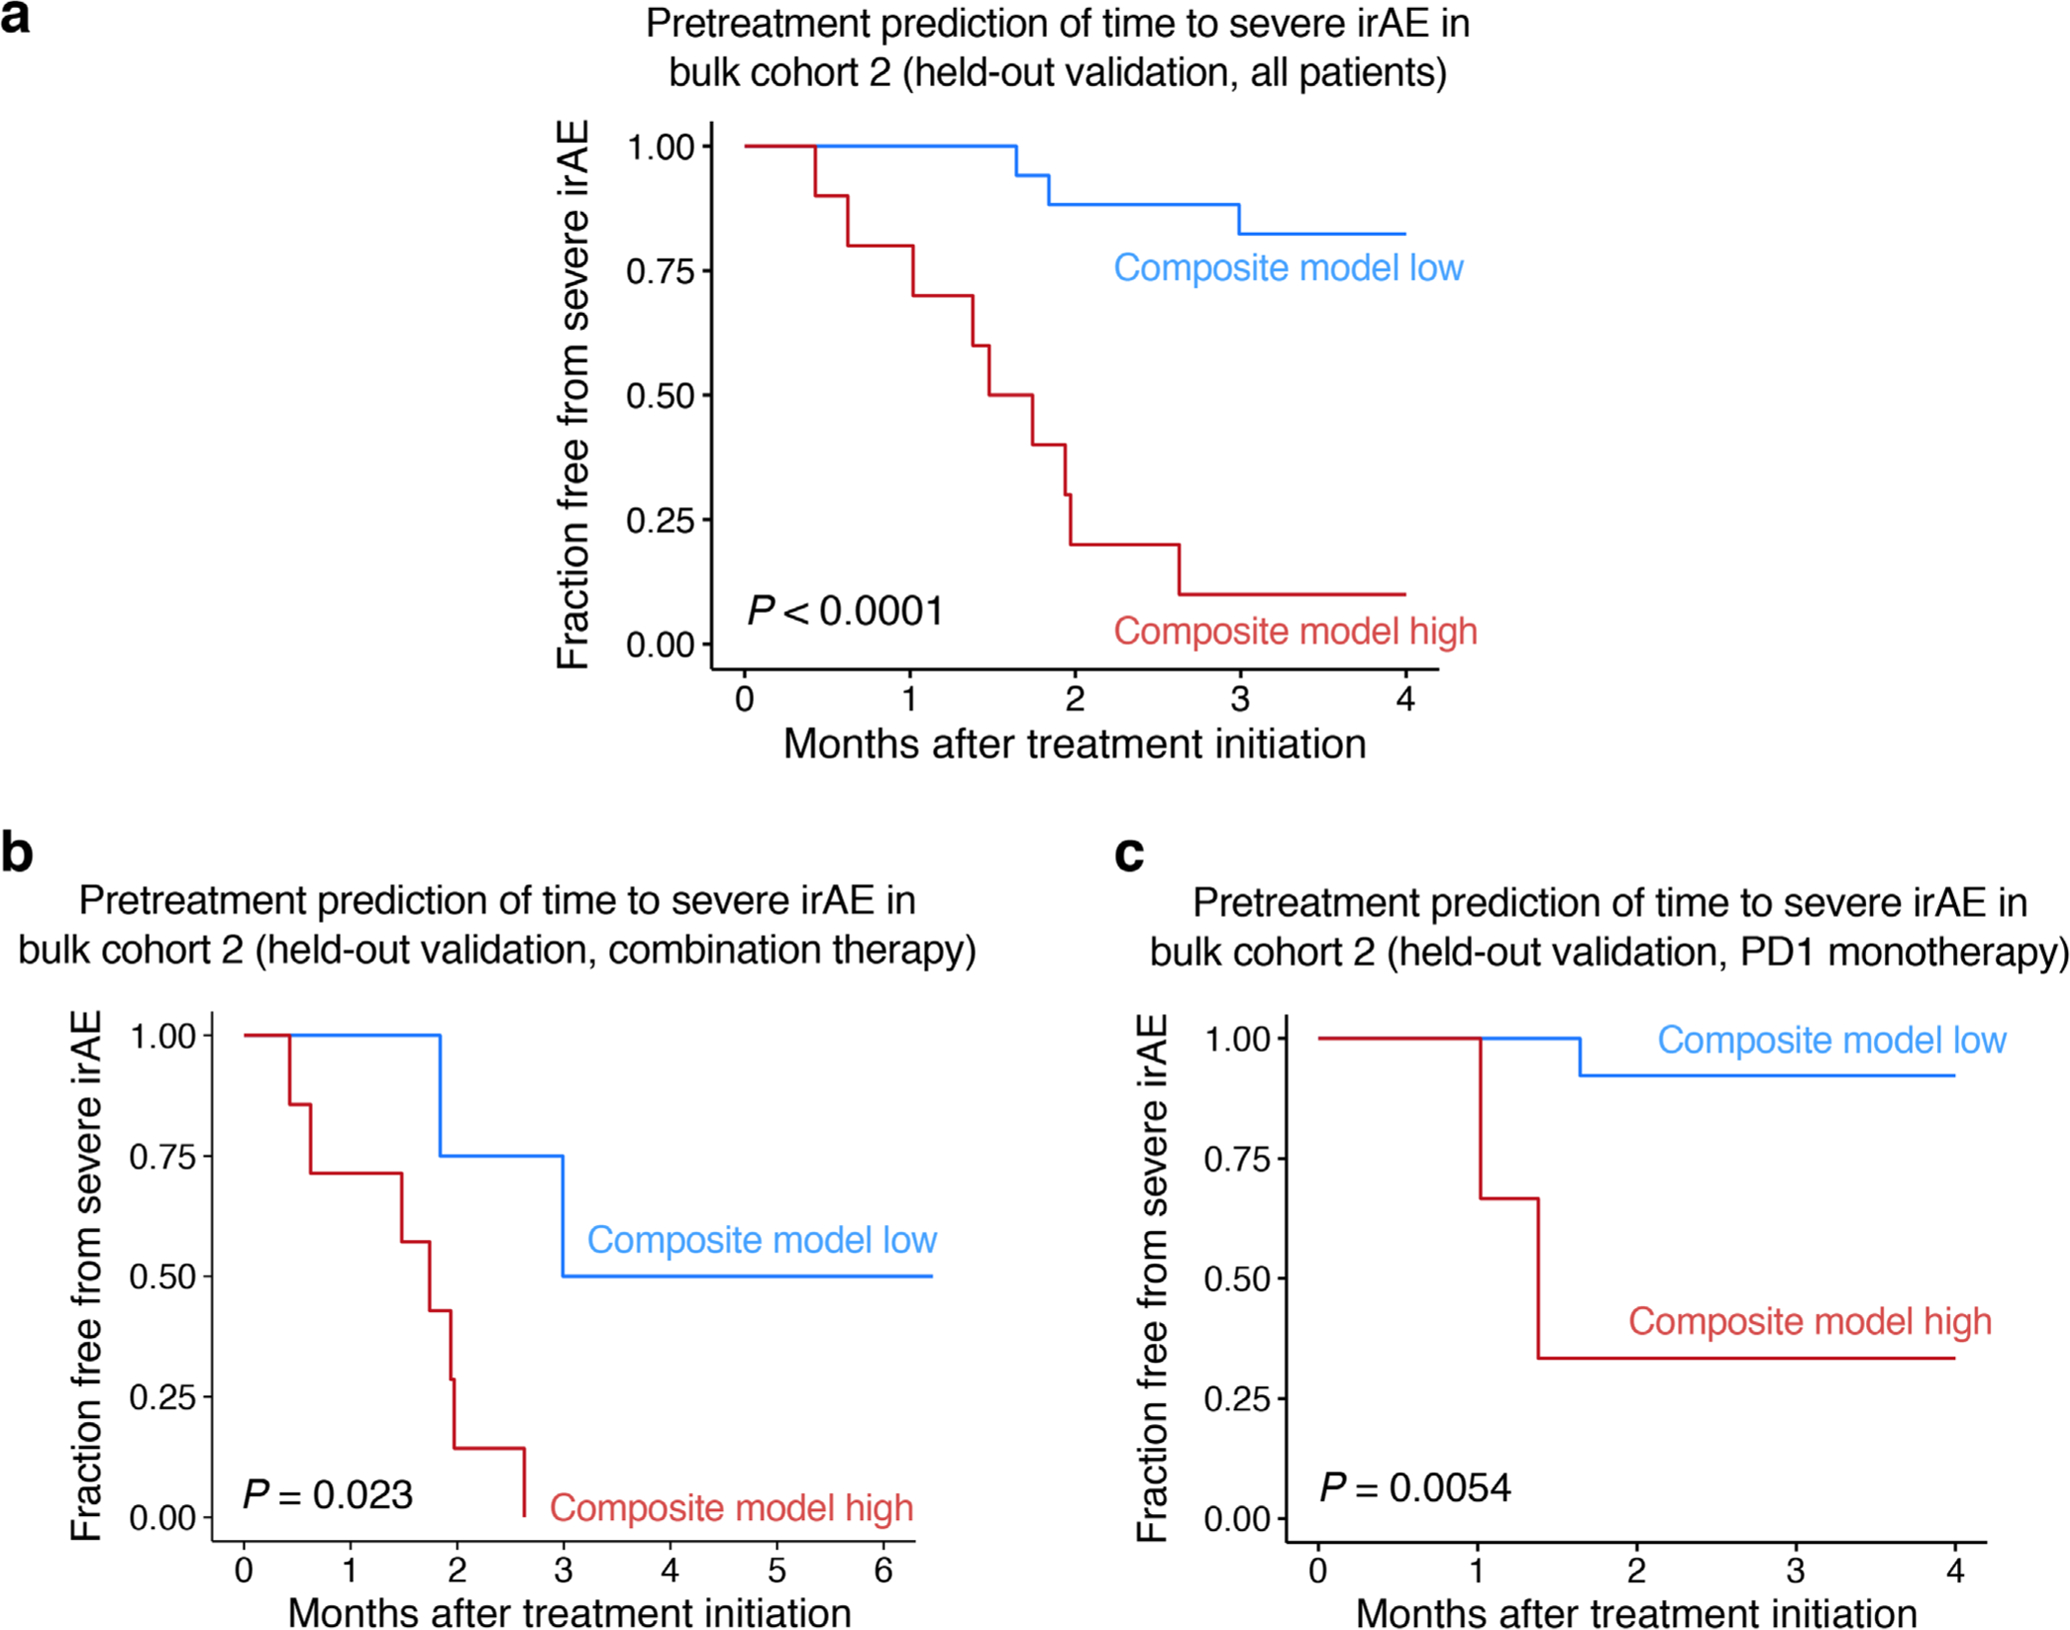
a–c, Kaplan-Meier analysis for freedom from severe irAE in bulk cohort 2 for patients treated with combination or PD1 immune checkpoint blockade (a), combination therapy (b), or PD1 monotherapy (c), stratified by the composite model score (Methods). Statistical significance was calculated by a two-sided log-rank test. In all panels, training was performed in bulk cohort 1 and the cut-point predicting severe irAE was optimized for bulk cohort 1 using Youden’s J statistic (Supplementary Table 10; Methods). Notably, the analyses in a–c were landmarked between treatment initiation and three months following treatment initiation, with all severe irAEs occurring within this period. The Kaplan-Meier plots are shown out to four months given the extended follow-up of patients that did not develop any severe irAE (Supplementary Table 9).